
.jpg)
Key Takeaways
- Coffee shops win on frequency, not ticket size, so the smartest growth lever is repeat ordering.
- Pickup-first behavior shapes the whole operation, from checkout speed to handoff flow.
- The strongest ordering windows cluster in the morning and at lunch, with clear weekly swings between Friday and Monday.
- Re-engagement has to happen quickly in coffee, because the reorder cycle is short and habit-driven.
- Our data shows Cafe & Coffee makes up about 14% of cuisine volume, with AOV at $15-20 and more than 75% of orders in pickup or dine-in.
How big is the cafe industry?
The cafe and coffee category is one of the largest and most frequent slices of food service, but its scale hides a thin-ticket, habit-driven business model that operators feel every single shift.
Start with the numbers that make the category real. The global coffee market was valued at $249.3 billion in 2025 and is projected to reach $380.3 billion by 2033 at a 5.4% CAGR. Demand at home is just as strong: 73% of Americans drink coffee every day, and consumption is at a 20-year high, up 37% since 2004\.
That scale matters, but size alone does not explain how a coffee shop actually performs. A large market can still produce small baskets. According to our data from the Restolabs 2026 Online Ordering Behaviour Report, Cafe & Coffee accounts for about 14% of cuisine volume across the platform, which makes it a meaningful ordering segment rather than a rounding error next to pizza or burgers.
Here is where operator reality diverges from the headline market value. A busy morning does not mean a rich morning. Coffee orders are small, so the number that determines whether the month works is not how much each guest spends, but how often they come back.
That single shift from ticket size to visit frequency is the lens for everything that follows.
Why do coffee shops depend on frequency, not basket size?
Coffee shops run on repeat visits because a low average ticket means no single order carries the week. Retention and habit matter far more than upselling a bigger basket.
A $15-20 average order value changes the entire growth model. When each transaction is small, you cannot rely on a handful of large orders to hit your targets. What you need is the same guest walking through the door three times a week. Our data puts Cafe & Coffee AOV at roughly 50% lower than higher-ticket restaurant verticals, so the math only works when frequency does.
Consider two shops with identical traffic. The one that turns a first-time buyer into a weekly regular quietly outearns the one chasing a slightly bigger single order. That is the whole game in coffee: small tickets that compound through repetition.
The demographics back this up. 64% of consumers aged 25 to 39 consume specialty coffee weekly, which is exactly the habit loop that rewards retention over one-time acquisition.
Most industry coverage fixates on raising the average check. In coffee, the order data points somewhere else entirely: protect the habit, and the lifetime value takes care of itself. For a deeper look at why keeping customers beats chasing new ones, Restolabs' guide on customer retention over acquisition covers the economics in full.
Why does pickup-first coffee behavior matter?
Pickup and dine-in dominate coffee ordering, so speed and clarity at checkout and handoff matter far more than a delivery-heavy strategy built for other verticals.
According to our data, more than 75% of Cafe & Coffee orders are pickup or dine-in. That single fact reshapes operational priorities. The coffee customer is usually not browsing a long menu or waiting on a driver. They want speed and certainty: order fast, know exactly when it is ready, grab it, go.
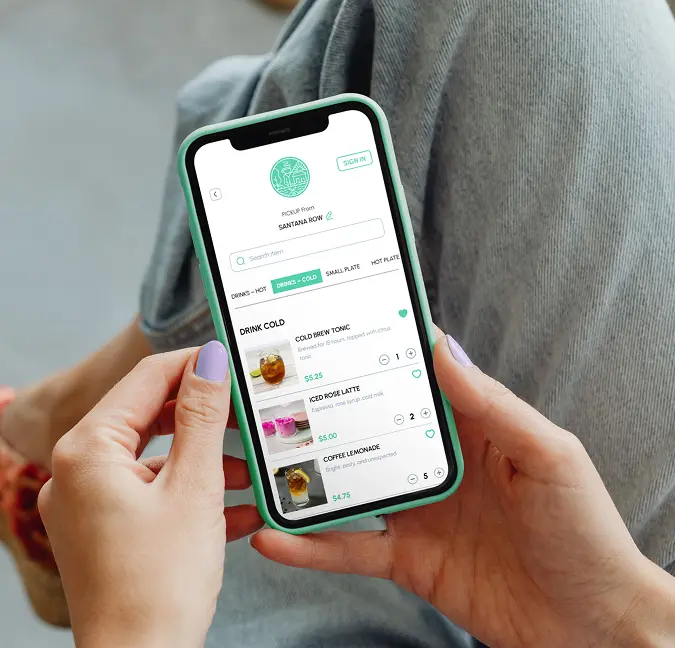
This changes what a good ordering flow looks like. Long checkout steps, unclear pickup timing, and a messy handoff counter all cost you during the rush, when a stalled queue directly bleeds revenue. The digital shift reinforces this: mobile ordering and delivery apps drive the majority of out-of-home cafe sales, with loyalty app usage up 47% and digital payment adoption reaching 62% in specialty shops.
Mobile pre-ordering is valuable in coffee precisely because it removes friction from the moment demand spikes. It is not about matching delivery-first playbooks from other categories. It is about getting the regular in and out before their commute clock runs out.
When do coffee customers order most?
Coffee demand is not flat across the day. It clusters into sharp windows, with Friday as the busiest day and Monday the quietest, so staffing and promotional messaging should follow those peaks rather than treat every hour equally.
Treating coffee demand as an all-day average hides the real rushes. The morning surge is where prep speed and a simple checkout earn their keep, because a slow line during that window turns into walkaways. Lunch rewards menu visibility that supports quick decisions, and the dinner window is one many coffee shops leave on the table entirely.
Use this to time your promotions deliberately. Push bakery pairings during the morning window, feature quick lunch combos midday, and treat Monday as a deliberate win-back day rather than a write-off. For more on timing coffee promotions effectively, see Restolabs' breakdown of the best times to promote your coffee shop online.
How fast should coffee shops re-engage customers?
Coffee customers return fast, so re-engagement has to happen in days, not weeks. The reorder cycle is short, and the best moment to bring someone back is right before their next habitual order would naturally land.
According to our data, the median time between repeat orders is 8.9 days. That is a tight loop. A customer who ordered on Wednesday is often ready again by the following week, and if you wait a month to reach out, the habit has either reset or drifted to a competitor.
The optimal re-engagement window sits at Day 7 to 10, right in the gap before that next order would naturally happen. Month 1 shows the highest engagement overall, which is when a new customer is most likely forming the habit that carries their lifetime value. Months 3 to 4 represent the key retention window, the point where regulars either lock in or quietly fade away.
This is where the 25 to 39 age group matters. That cohort is the most valuable in specialty coffee, and they respond to timely, digital-native nudges. A well-timed reminder on Day 8, tied to a customer's usual order, does more than a broad discount blast sent on the wrong day. Coffee loyalty is built on short cycles, so consistency and timing beat depth of discount every time.
What do repeat-customer economics look like in coffee?
Repeat rate, orders per customer, and lifetime spend combine to make coffee a genuinely valuable category despite the small ticket. The value lives in habit and frequency, not in any single transaction.
According to our data, Cafe & Coffee has a 38.2% repeat customer rate over a six-month lookback. That number carries weight because coffee behaves like a routine, not a special occasion. Guests are not deciding whether to treat themselves; they are on their way to work and the shop is part of the ritual.
Layer in 3.2 orders per customer and $123.79 in average customer lifetime spend, and you see how small tickets compound. No single $15 order looks impressive on its own. Multiply it across a returning regular over months, and the segment starts to look very different from its low AOV.
The scale of the category reinforces the point. U.S. coffee shop industry revenue reached $49.5 billion in late 2024, with more than 40,000 shops operating. That volume is built almost entirely on repeat, low-ticket transactions. The segment rewards systems that keep customers coming back without adding friction, which is exactly where an owned ordering flow earns its return.
How does Restolabs help coffee shops own direct ordering?
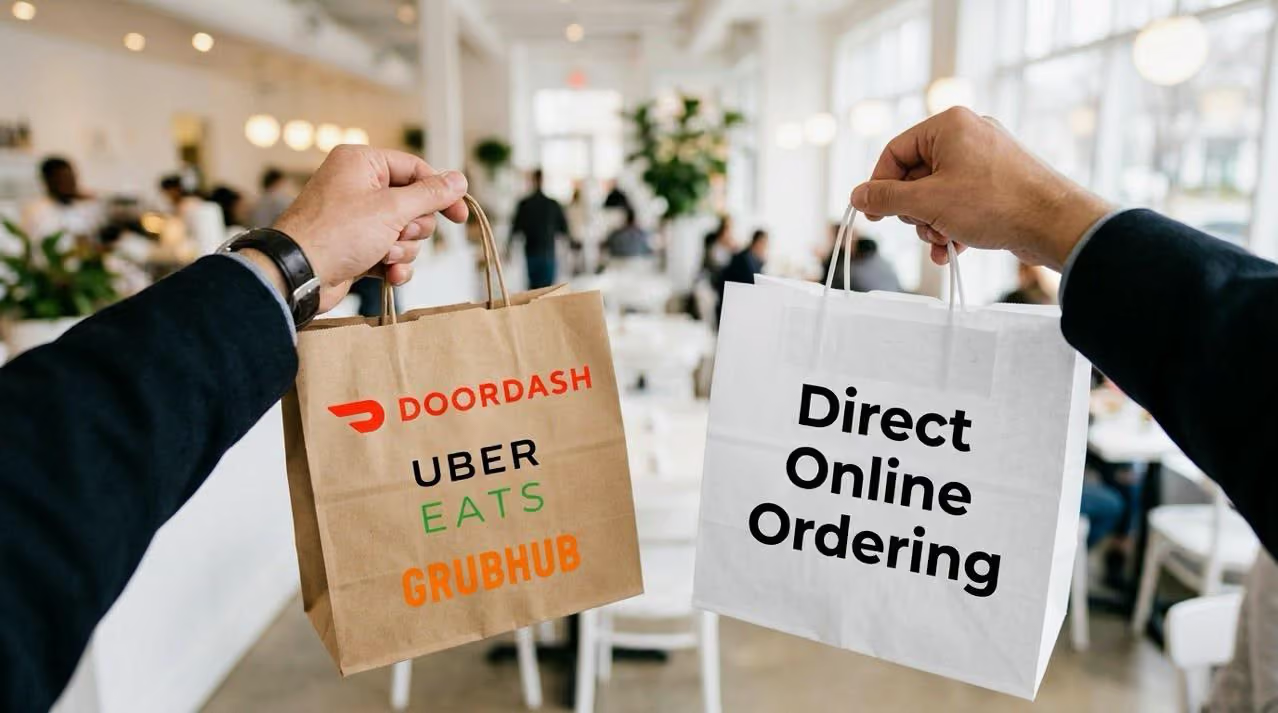
Coffee operators need an ordering flow built for how the category actually behaves: pickup-heavy, repeat-driven, and fast to re-engage. That means owning the customer relationship instead of renting it from a marketplace.
Restolabs gives coffee shops a direct ordering system where speed and control come first. Fast checkout and clear pickup timing match the pickup-first reality, so the morning rush moves instead of stalling. Full ownership of customer data means the Day 7 to 10 re-engagement window is something operators can actually act on, rather than a moment a third-party app keeps for itself. Because the platform is commission-free, more of every small ticket stays with the shop, which matters most in a low-AOV, high-frequency category.
The point is not a longer feature list. It is that the numbers in this article, thin tickets, frequent reorders, and short habit loops, all favor a business that controls its own ordering and its own customer relationships.
Ready to take back your online ordering? Book a Demo

Sruthi Sekar specializes in brand strategy, growth, and user experience in the hospitality industry. As the driving force behind Restolabs, she helps restaurants harness technology to scale and thrive. With a background in design, branding, and entrepreneurship, she brings a sharp focus on crafting digital experiences that drive real business impact.
Frequently Asked Questions
The cafe category remains a major part of food service demand. The global coffee market was valued at $249.3 billion in 2025 and is projected to reach $380.3 billion by 2033, and 73% of Americans drink coffee daily. Our data shows Cafe & Coffee at about 14% of cuisine volume on the Restolabs platform.
Our data from the Restolabs 2026 Online Ordering Behaviour Report shows Cafe & Coffee AOV at $15-20, roughly 50% lower than higher-ticket restaurant verticals.
Coffee buyers usually want speed and convenience rather than a long browsing session or a delivery wait. Our data shows more than 75% of Cafe & Coffee orders are pickup or dine-in, which is why fast checkout and a clear handoff flow matter most.
The strongest windows are weekend mornings from 7 to 10 AM and lunch from 11 AM to 1 PM, with a further peak at dinner from 5:30 to 8:30 PM. Friday is the highest ordering day and Monday the lowest.
Our data shows a median of 8.9 days between repeat orders, with Day 7 to 10 as the optimal re-engagement window.
They show that coffee wins through habit and frequency. A 38.2% repeat rate, 3.2 orders per customer, and $123.79 in average lifetime spend mean small tickets become meaningful when customers return consistently.
Our data shows Cafe & Coffee is pickup-heavy, low-AOV, and repeat-driven, with fast re-engagement timing that matters more than one-time basket growth.






.webp)

.svg)
.webp)