
RESTOLABS
Online Ordering Behaviour Report
Proprietary data from the Restolabs platform
Executive Summary
This report analyses 4M+ restaurant orders processed through the Restolabs direct online ordering platform Mar 2025 - Mar 2026, spanning 2126 locations, 479 brands, and 10+ countries. It provides an authoritative view of online ordering behaviour across cuisines, geographies, time patterns, customer retention, delivery preferences, and brand performance.
Key Findings
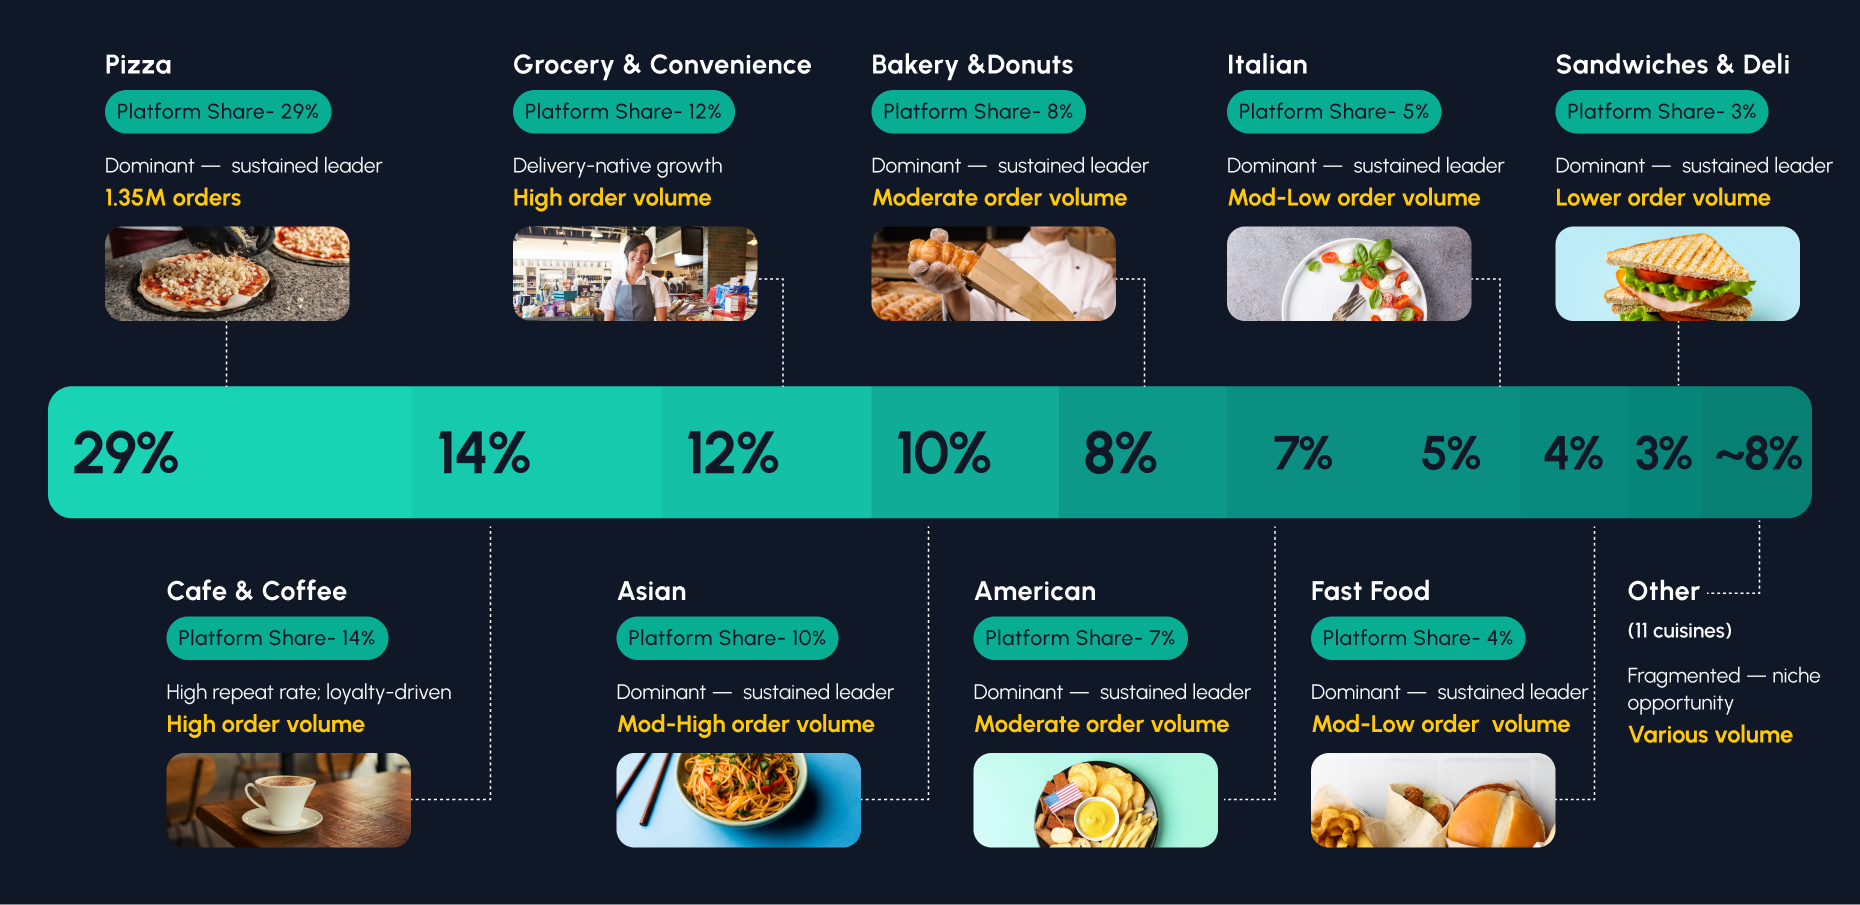
Pizza dominates with 1.35M orders — nearly 30% of all platform volume
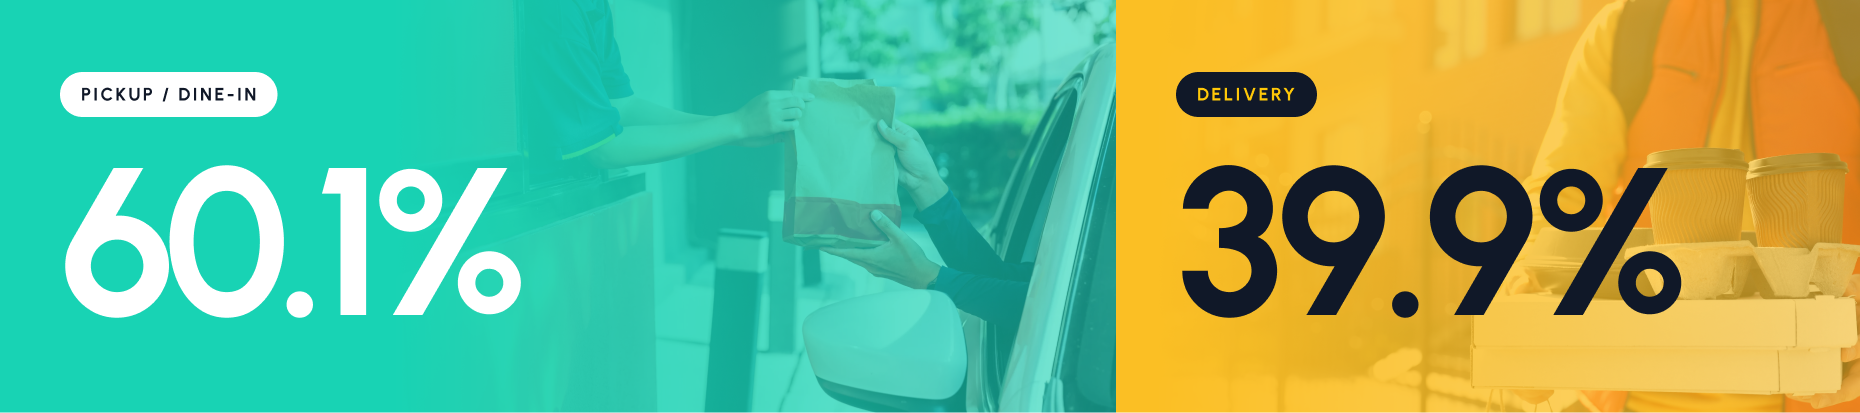
60.1% of orders are fulfilled via pickup with delivery at 39.9%
Sandwiches & Deli commands The highest average order value at $57.7
Friday leads platform-wide ordering volume, followed by Thursday and Saturday, with Monday recording the lowest order count

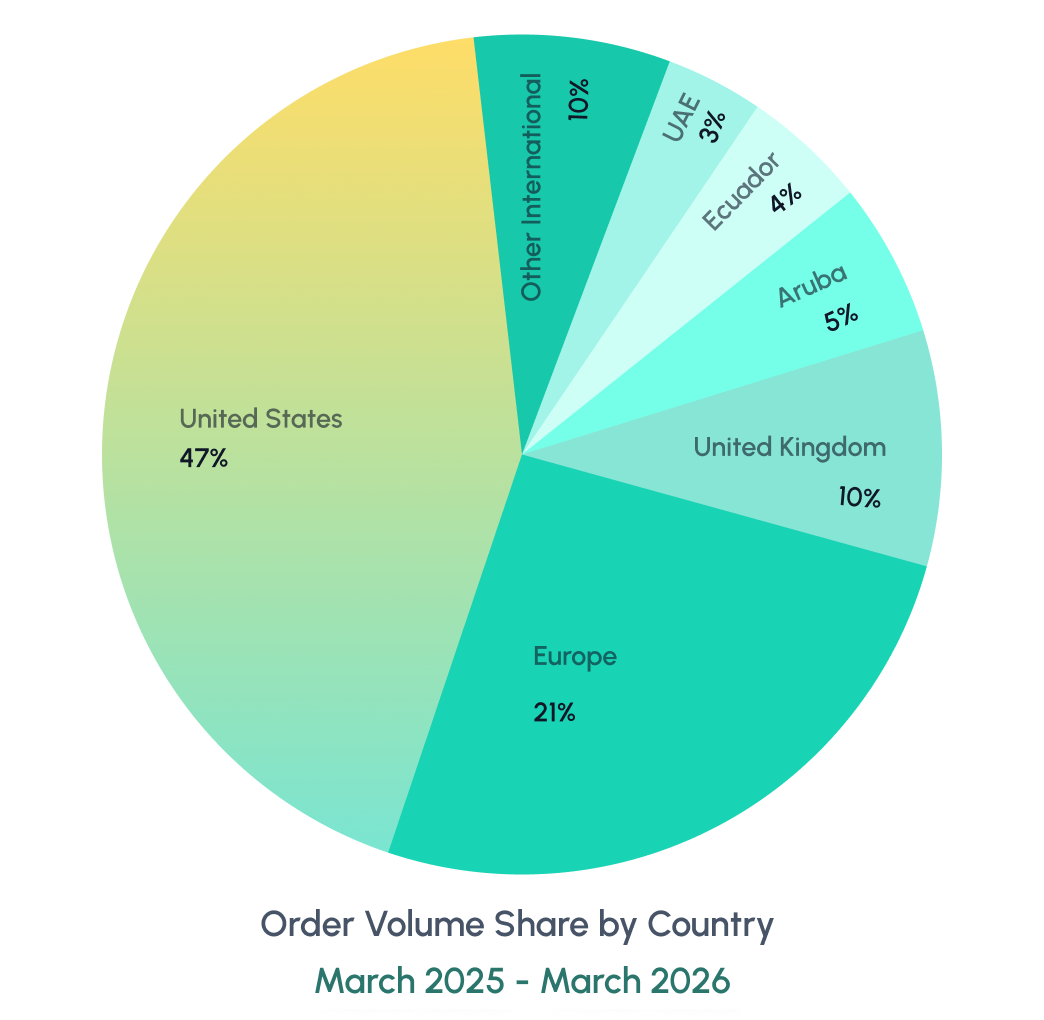
The United States accounts for the largest share of both orders and gross order value

Repeat customers order every 8.9 days on average, with a 38.2% repeat rate

Order Volume &
Platform Scale
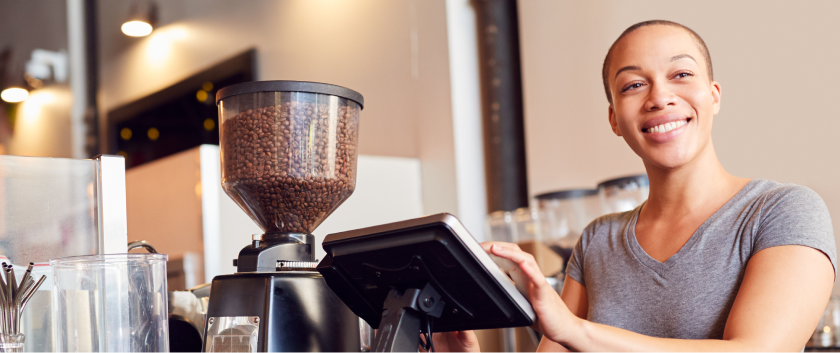
Restolabs processed nearly 4M+ direct orders in 2025-2026 — entirely commission-free. The platform's scale across 479 brands provides one of the most representative datasets of independent and multi-location restaurant ordering behaviour available.
284
3.2
97.4%
4,000,000+
Monthly Order Patterns
Order volume shows seasonal variation through 2025 to 2026. Order volume peaks in Q1 and Q3, with a mid-year dip across several cuisine categories. For restaurant operators, this signals clear seasonal windows to plan promotions, staffing, and menu changes — boosting orders during slower months and capitalising on peak periods.
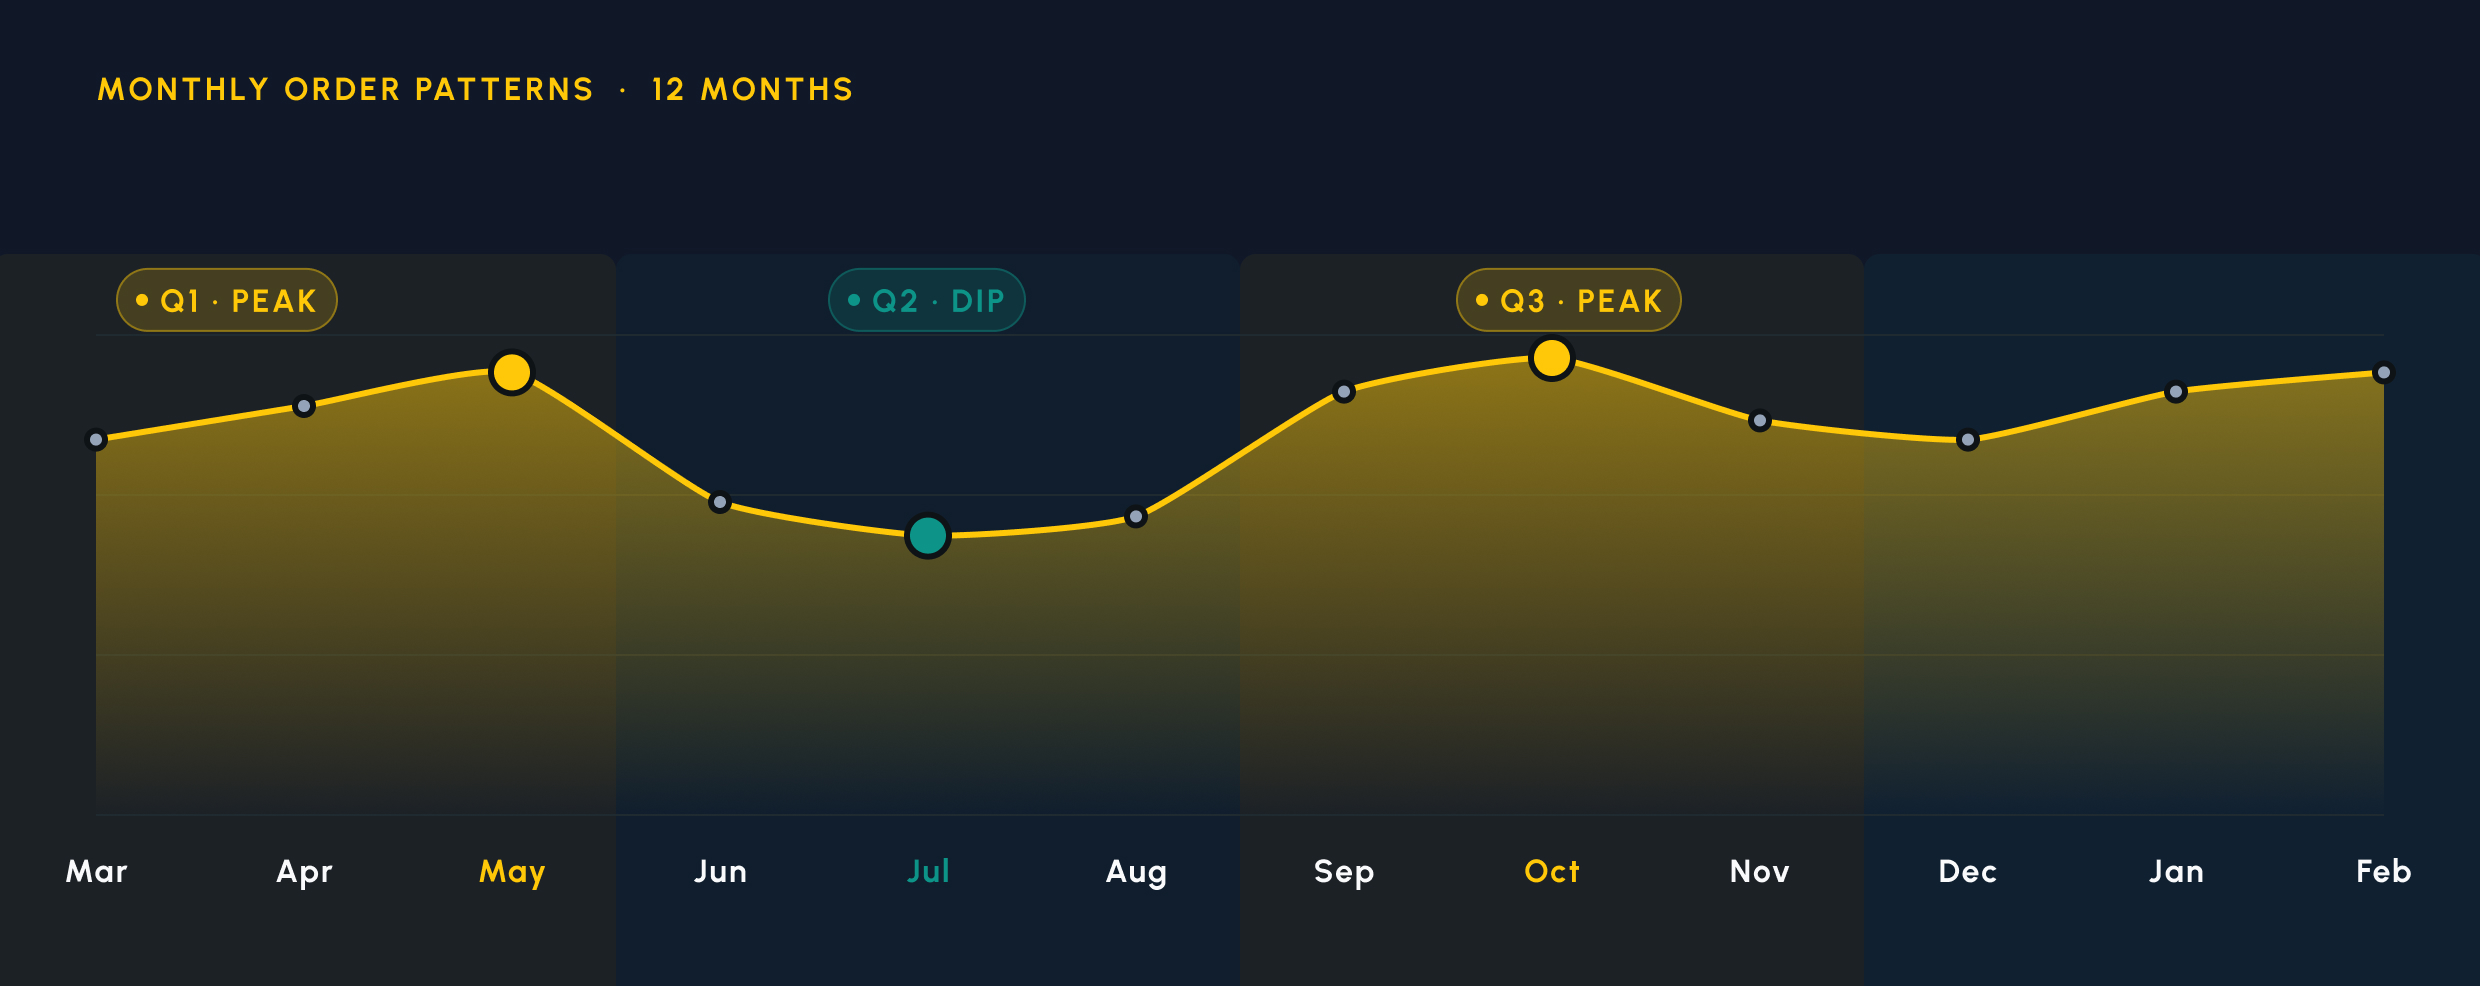
Key Insight:
The Avg Orders per Active Store peaked in early 2025 to 2026 and stabilised at a healthy cadence through the year, reflecting growing customer habituation to direct ordering.
Top Ordering Days
Friday leads overall platform ordering volume, followed closely by Thursday and Saturday. The weekend sees strong ordering activity, while Monday records the lowest volume — a consistent pattern across cuisines and geographies.
Order Timing: Hour of Day
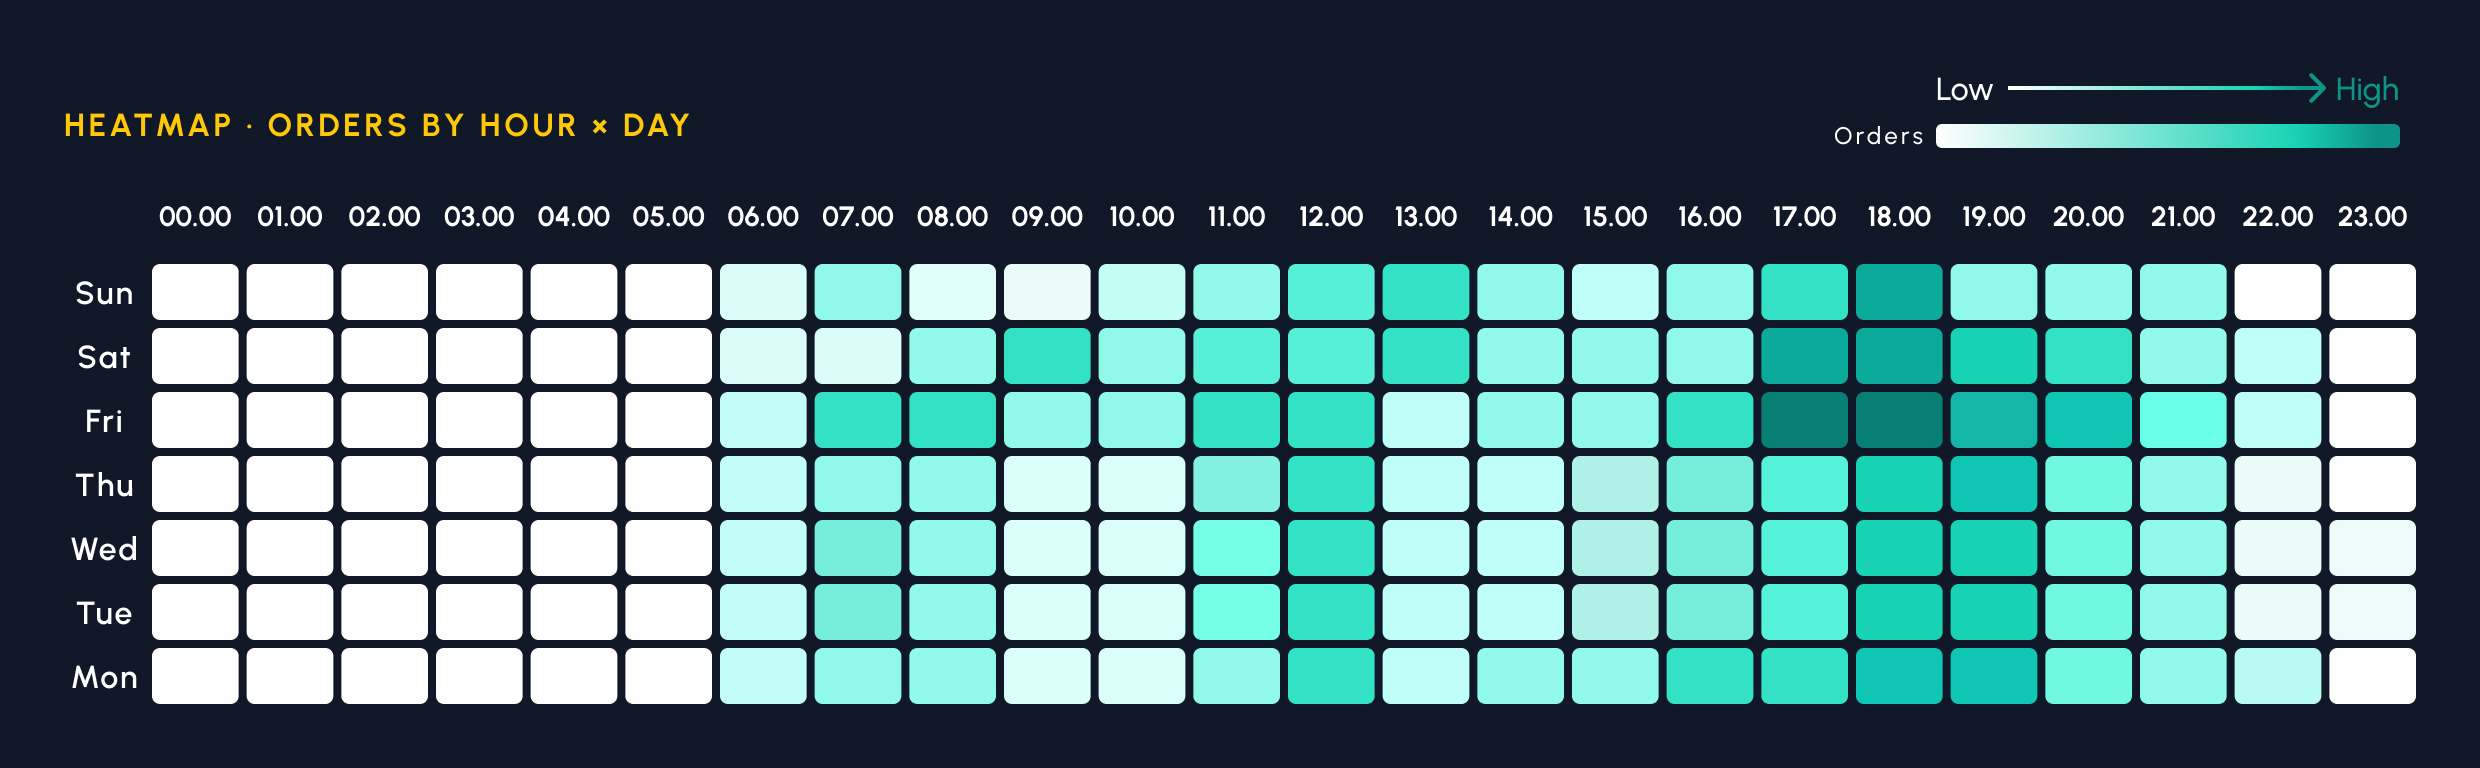
Platform-wide ordering peaks in the evening hours, with lunch (11:00 AM–1:00 PM) and dinner (5:30–8:30 PM) driving the bulk of daily volume. The heatmap (97.4% timezone-corrected) shows morning hours (7–10 AM) are comparatively light. The actionable windows are:
Weekend - Mornings:
7:00 AM – 10:00 AM (Coffee And Bakery Surge)
Lunch rush:
11:00 AM – 1:00 PM
Local Time
Dinner peak:
5:30 PM – 8:30 PM
Local Time
Late-night segment:
9:00 PM – 11:00 PM
(delivery-heavy, pizza dominant)
Day-of-week pattern:
Friday records the highest ordering volume platform-wide, with Saturday close behind. Sunday drops off compared to the weekend peak, and Monday is consistently the lowest day of the week — a weekend-led pattern, not a weekday surge.
What this means for your restaurant:
All operators
Align staffing, menu availability, and promotions to the dinner peak (5:30–8:30 PM local time). Friday is the highest-volume day platform-wide — schedule push notifications and for Thursday–Friday evenings when intent is strongest. Also re-engage customers who haven't ordered in 7–10 days and push winback campaigns and combos as ordering intent is anyway high on these days.

Win-back timing
The median reorder interval is 8.9 days — re-engage customers who haven't ordered in 7–10 days.

Pizzerias
Expand your ordering hours past 9 PM — the late-night slot is delivery-heavy and pizza-dominant.
Coffee shops & cafés
Monday is consistently the lowest-volume day — use it for win-back campaigns and loyalty/rewards based nudges for reorders. Promote coffee and pastry/bagel combos from Monday to Wednesday to lift the lowest-volume days.

Customer Behaviour
& Retention
Understanding ordering frequency, spend patterns, and retention dynamics is central to building a profitable direct ordering channel. The Restolabs 2025 - 2026 dataset reveals actionable benchmarks across all three dimensions.
38.2%
$123.79
8.9 days
20% New
80% Returning
Repeat Customer Rate
38.2% of customers placed more than one order within a 6-month lookback window. This rate climbed steadily through Mar 2025 - Mar 2026, reaching its highest point by mid-year as brands deployed loyalty programs and re-engagement campaigns.
Benchmark:
A repeat rate above 35% is considered strong for direct ordering platforms. Restolabs brands are performing at or above this threshold.
The 8.9-Day Reorder Window
The median interval between repeat orders is 8.9 days — a highly actionable number. This means the optimal window to re-engage a customer is day 7–10 post-purchase. Brands that deploy automated email, SMS, or push notifications at this window see measurably higher repeat rates.
re-engagement
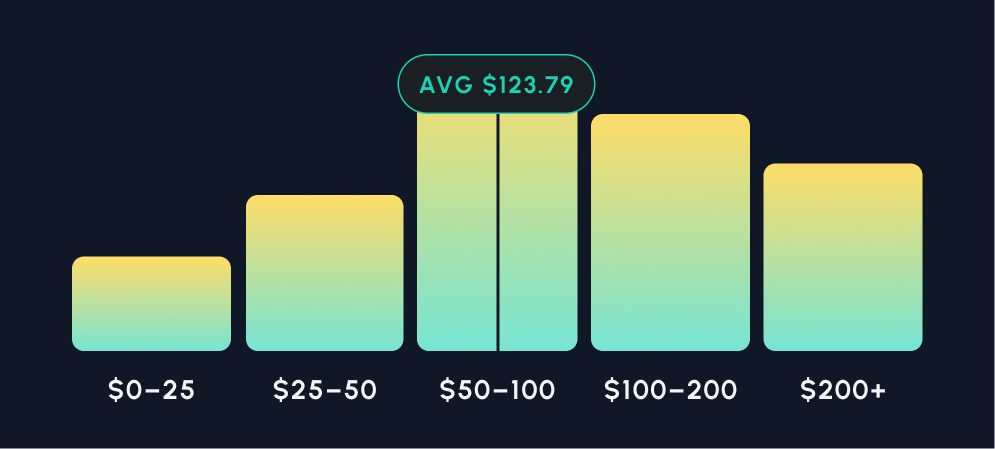
Customer Lifetime Spend
Distribution
Average customer lifetime spend from Mar 2025 to Mar 2026 was $123.79, spanning 3.2 orders per customer. The distribution is right-skewed: a meaningful cohort of high-value customers (spending $200+) drives disproportionate revenue. Loyalty programs that identify and nurture this segment deliver outsized returns.
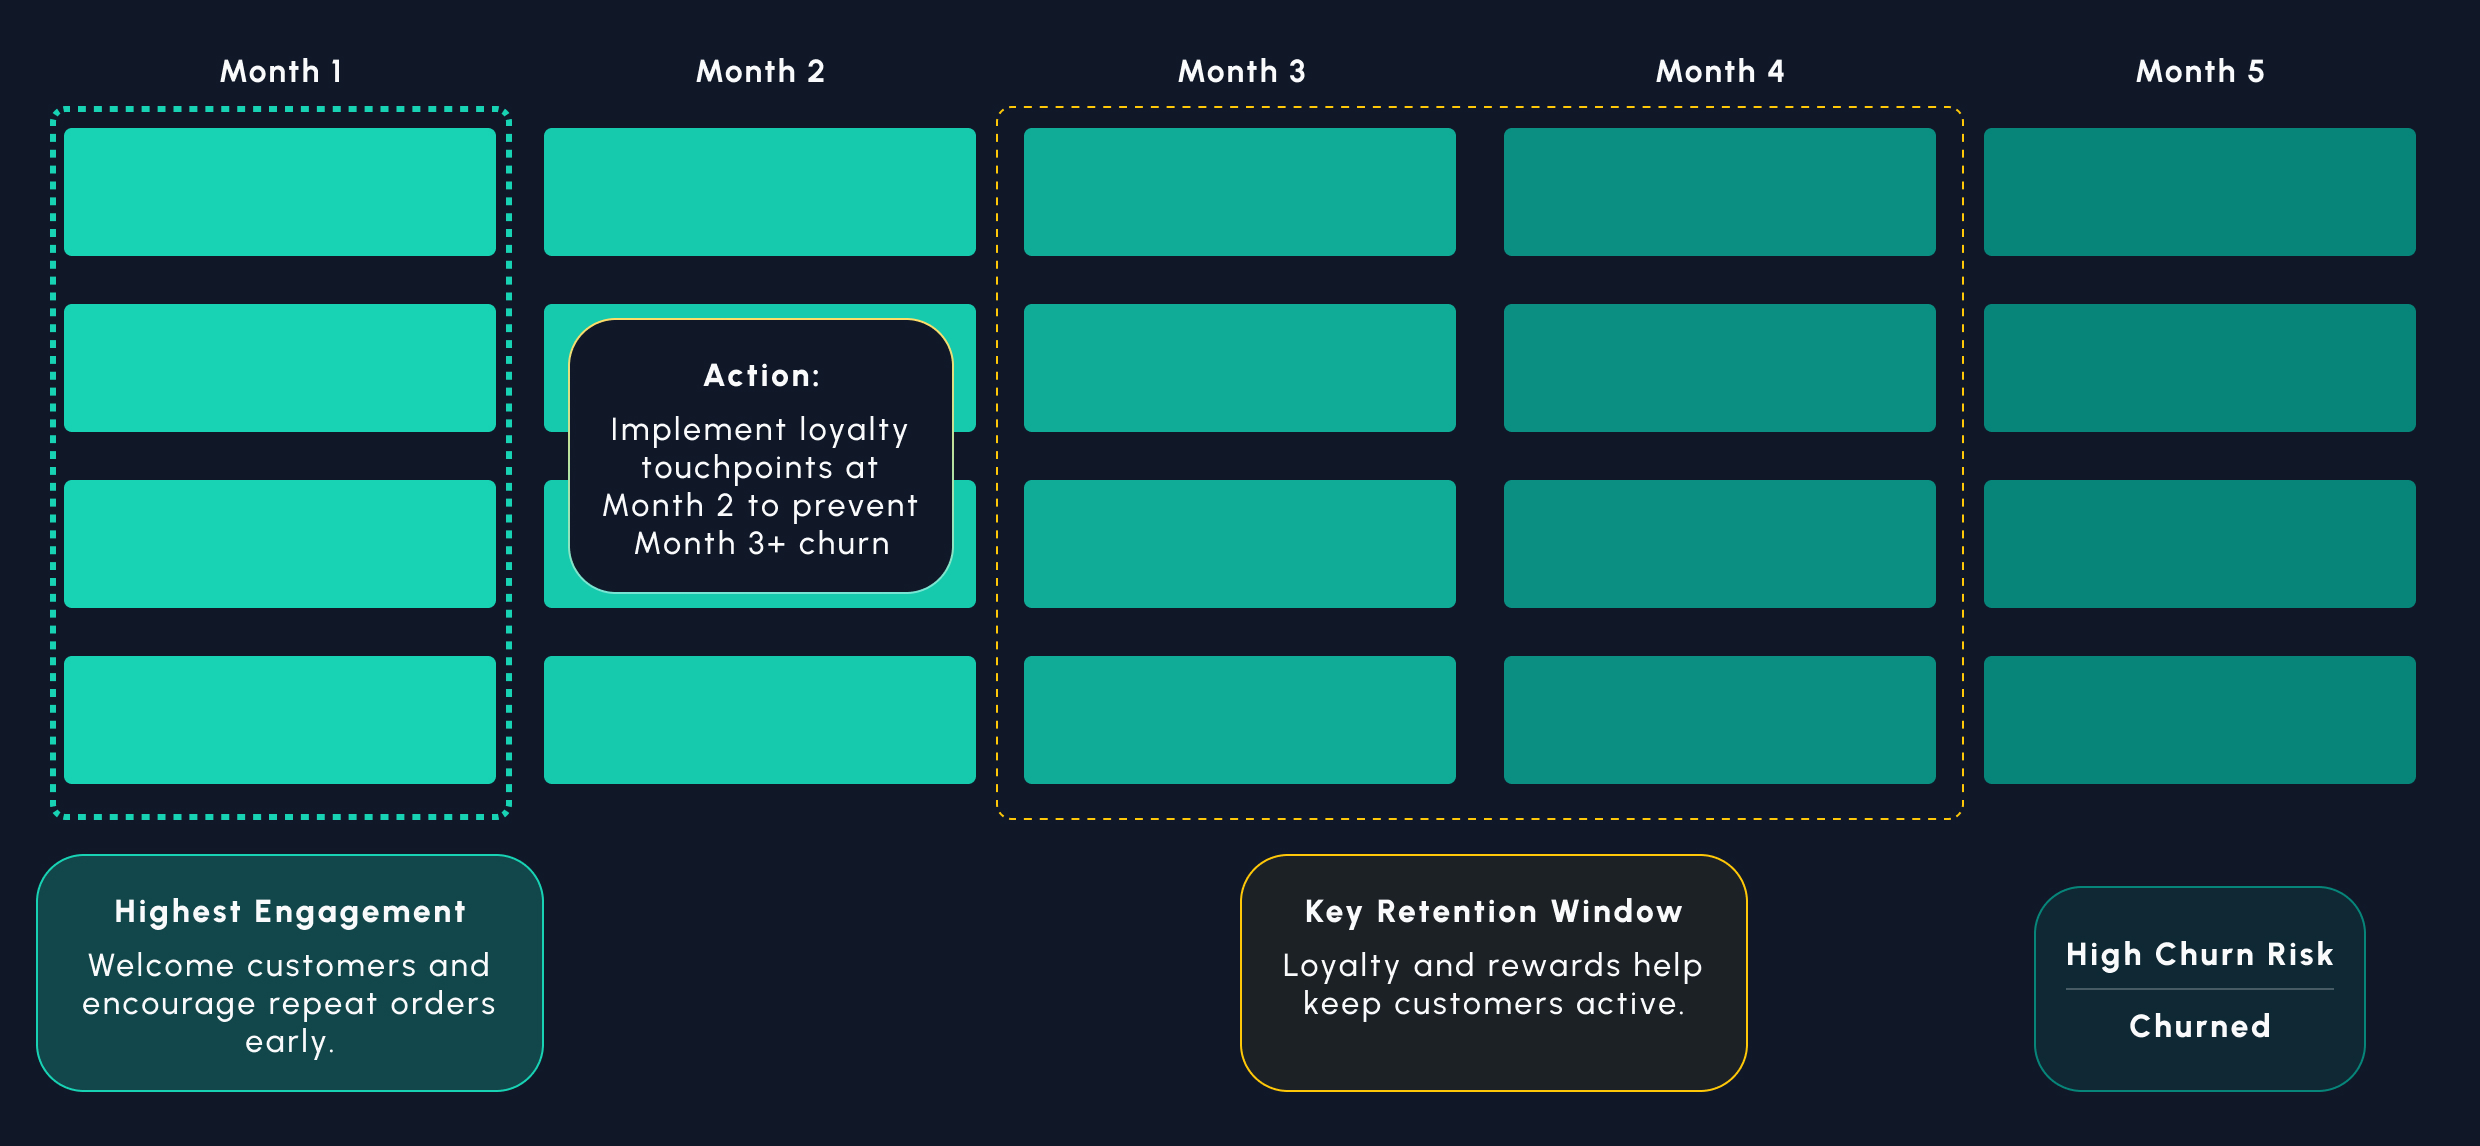
Cohort Retention Heatmap
Monthly cohort analysis tracks how many customers from each acquisition month continue ordering in subsequent months (M+1, M+2, M+3, and beyond). Maximum engagement is in month 1. Unless there is customer retention intervention through loyalty and rewards, the chances of churn increase sharply in months 3 and 4 — making the post–month 1 period the right time to strengthen repeat behaviour. When comparing cohorts, use the same lifecycle stage (e.g. all at month 3); earlier-year cohorts simply have longer follow-up windows.

Cuisine
Analytics
With 20 distinct cuisines represented across the platform, Restolabs data provides the most granular view of cuisine-level ordering behaviour available from a direct ordering source. Each cuisine category reveals distinct patterns in order volume, average spend, and delivery preference.
20
Pizza
$57.77
99.8%
>75%
~10%
Order Volume by Cuisine
Average Order Value by Cuisine
Average order value varies significantly by cuisine — a critical factor for revenue optimisation.
Sandwiches & Deli leads at $57.77, nearly 50% above the platform average of $38.96, driven by catering and group orders.
Bakery & Donuts and Cafe & Coffee show lower AOV per order — a single coffee or pastry purchase is typically $15-20— but these segments compensate through exceptionally strong repeat rates, loyal regulars, and high order frequency. Their true value lies in customer lifetime spend, not single-order AOV.
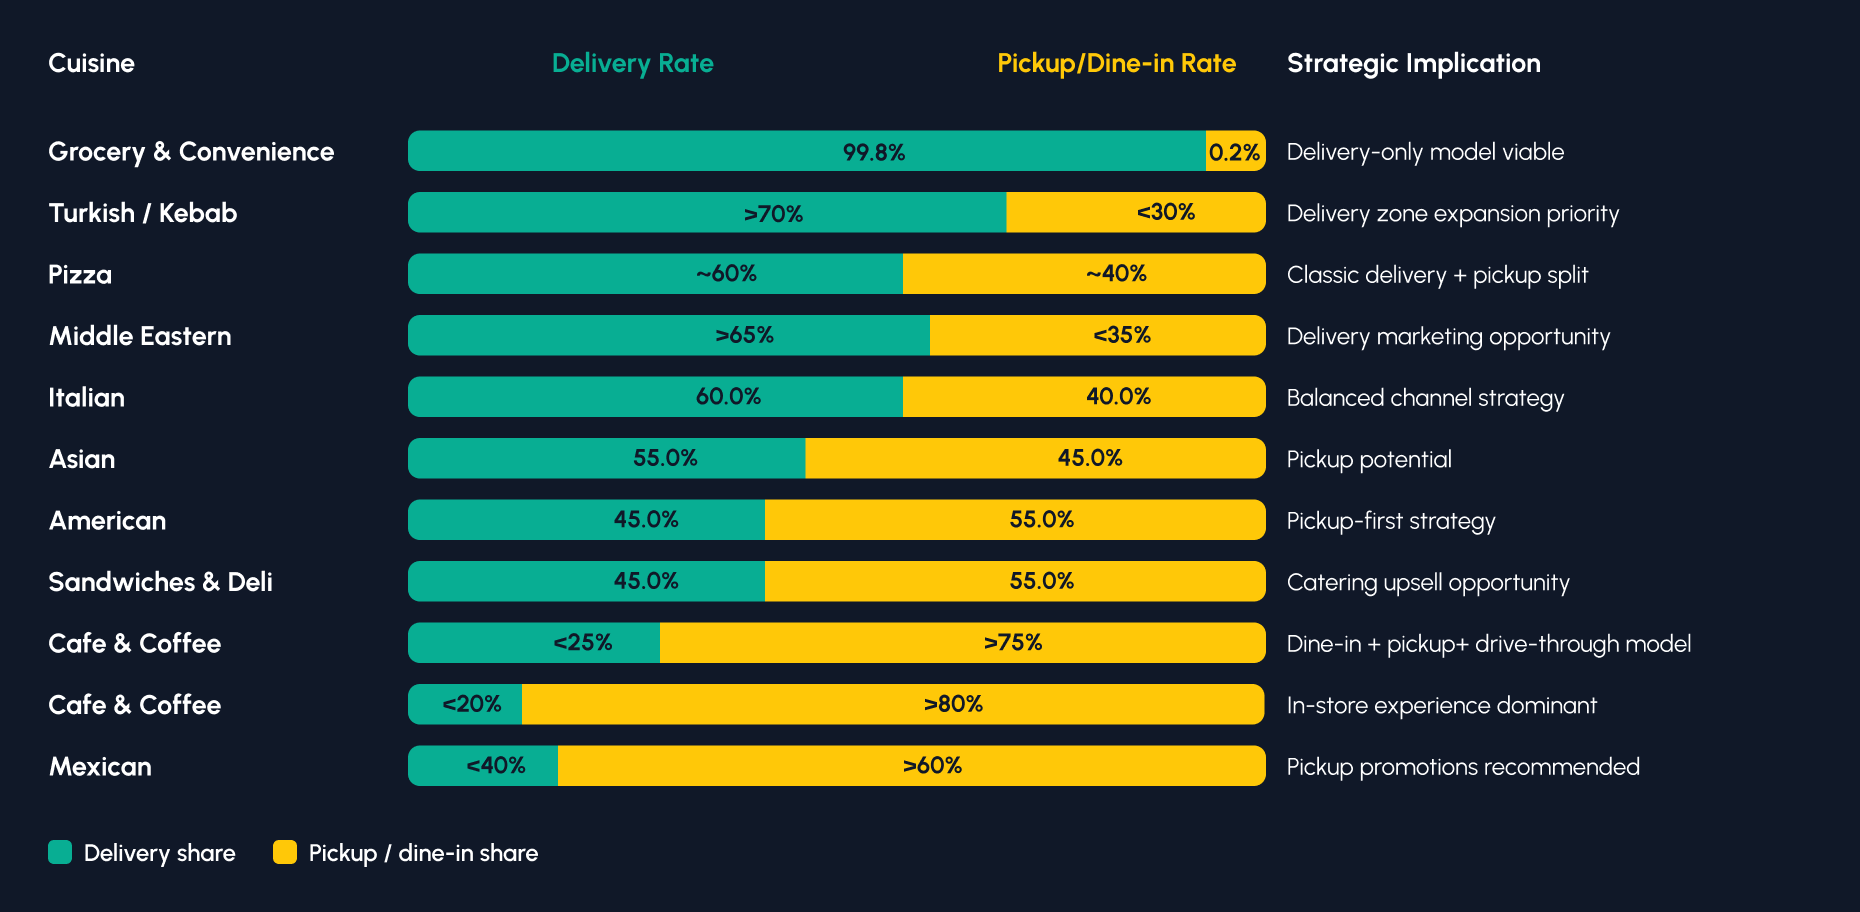
Delivery Rate by Cuisine
Not all cuisines are created equal when it comes to delivery. Grocery & Convenience is almost entirely delivery-driven at 99.8%, while Turkish/Kebab, Pizza, and Middle Eastern cuisines show strong delivery propensity. At the other end, Bakery & Donuts (high pickup rate) and Cafe & Coffee (dine-in and pickup dominant) reflect the in-store experience and customer preference for pickup convenience expectations of their customer base.

Delivery &
Fulfillment Analysis
Fulfillment mode is one of the most operationally significant dimensions of online ordering behaviour. The 2025-2026 data reveals a platform that is strongly pickup-oriented overall, with delivery concentrated in specific cuisine categories and geographies.
$2.26
$3.2M+
$1–$15
Delivery vs Pickup Trend
The delivery/pickup split remained broadly stable through the year, hovering around 40/60 across most months. This ratio is notable because it inverts the typical third-party platform assumption that most restaurant orders are delivered. On direct ordering platforms, customers skew toward pickup — a higher-margin, lower-complexity fulfillment mode for restaurants.
Insight:
Restaurants on Restolabs are capturing more pickup orders than industry averages suggest — a strong argument for the economics of direct ordering vs. delivery-first platforms.
Delivery Fee Distribution
The majority of delivery fees charged through the platform fall in the $1–$7 range, with the modal fee under $5. This low-fee positioning is a key driver of customer conversion on delivery orders — high delivery fees are consistently cited as the #1 reason customers abandon cart on third-party apps and is validated here.
Fulfillment
by Cuisine
Coffee shops, bakeries, and breakfast/pastry concepts — which are naturally pickup-heavy — should lean into pre-order convenience, pickup speed, and loyalty-driven repeat visits to capitalize on their strong customer retention advantage.

Geographic
Insights
Restolabs operates across 10+ countries, with the United States accounting for the dominant share of both order volume and gross order value. International markets — particularly UK, Europe , Singapore, and the UAE — represent growing and distinct ordering behaviours.
Country-Level Performance
US State-Level Distribution
Within the United States, order volume is concentrated in a defined set of active states, led by Tier 1 markets (New York, North Carolina, and Illinois) and supported by Tier 2 markets (Florida, Pennsylvania, Georgia, California, and Texas)..
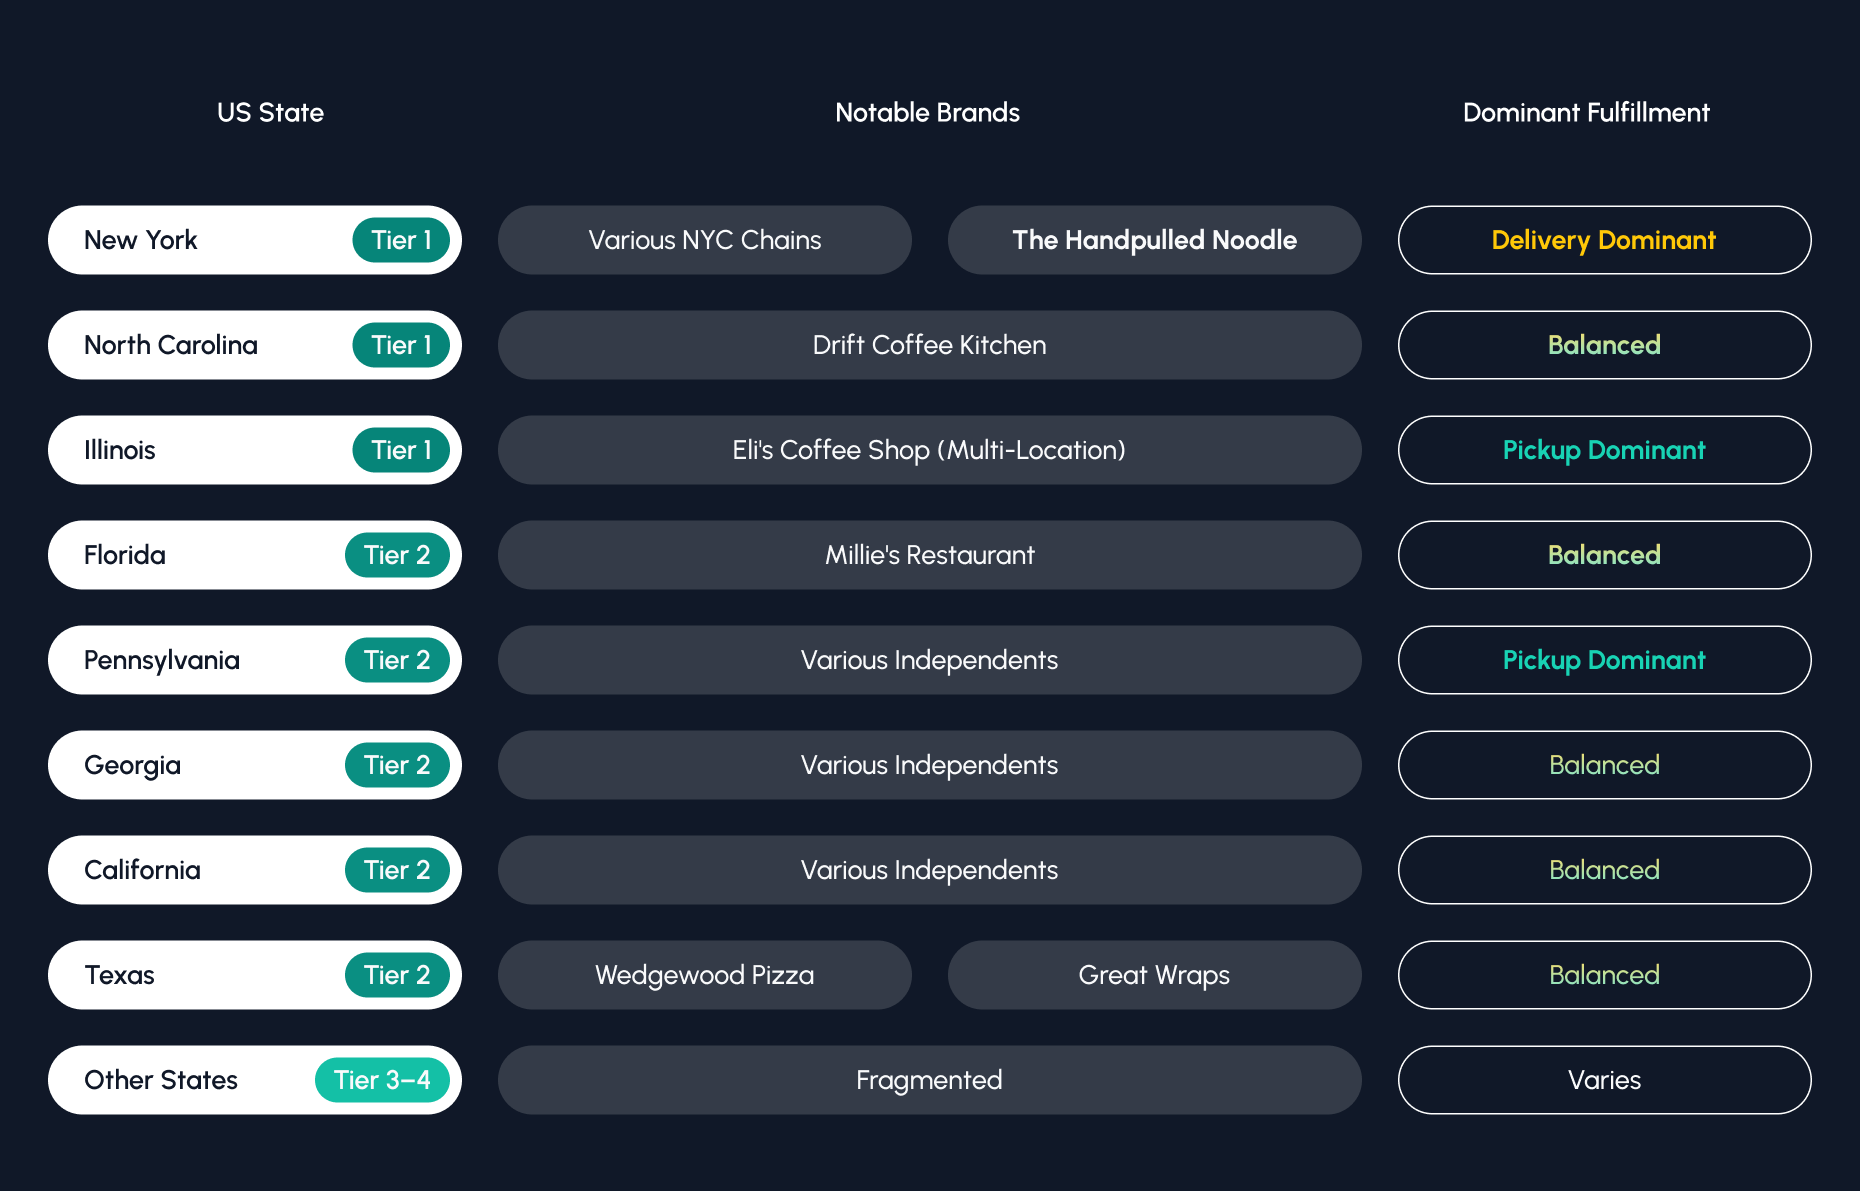
Geographic Ordering Behaviour Differences
Key behavioural differences emerge across geographies that have direct content and marketing implications:


cuisine dominant


Brand
Intelligence
The platform hosts 500+ distinct brands across single-location independents and multi-location chains. The top 15 brands by order volume represent a cross-section of cuisine types, geographies, and growth trajectories that illuminate what high-performing direct ordering looks like in practice.
Top 15 Brands by Order Volume & GOV
The platform hosts 500+ distinct brands across single-location independents and multi-location chains. The top 15 brands by order volume represent a cross-section of cuisine types, geographies, and growth trajectories that illuminate what high-performing direct ordering looks like in practice.
Heading
Most brands operate between 1–5+ locations. A meaningful cohort operates 15+ locations, and a significant cohort of enterprise chains operates 20–40+ locations.
Chains vs Single-Location Brands
The platform serves both chain restaurants and single-location independents. Chains drive higher absolute order volumes, while single-location brands often show stronger customer loyalty and repeat rates. The data shows:

.webp)

.svg)
.webp)