
Key Takeaways
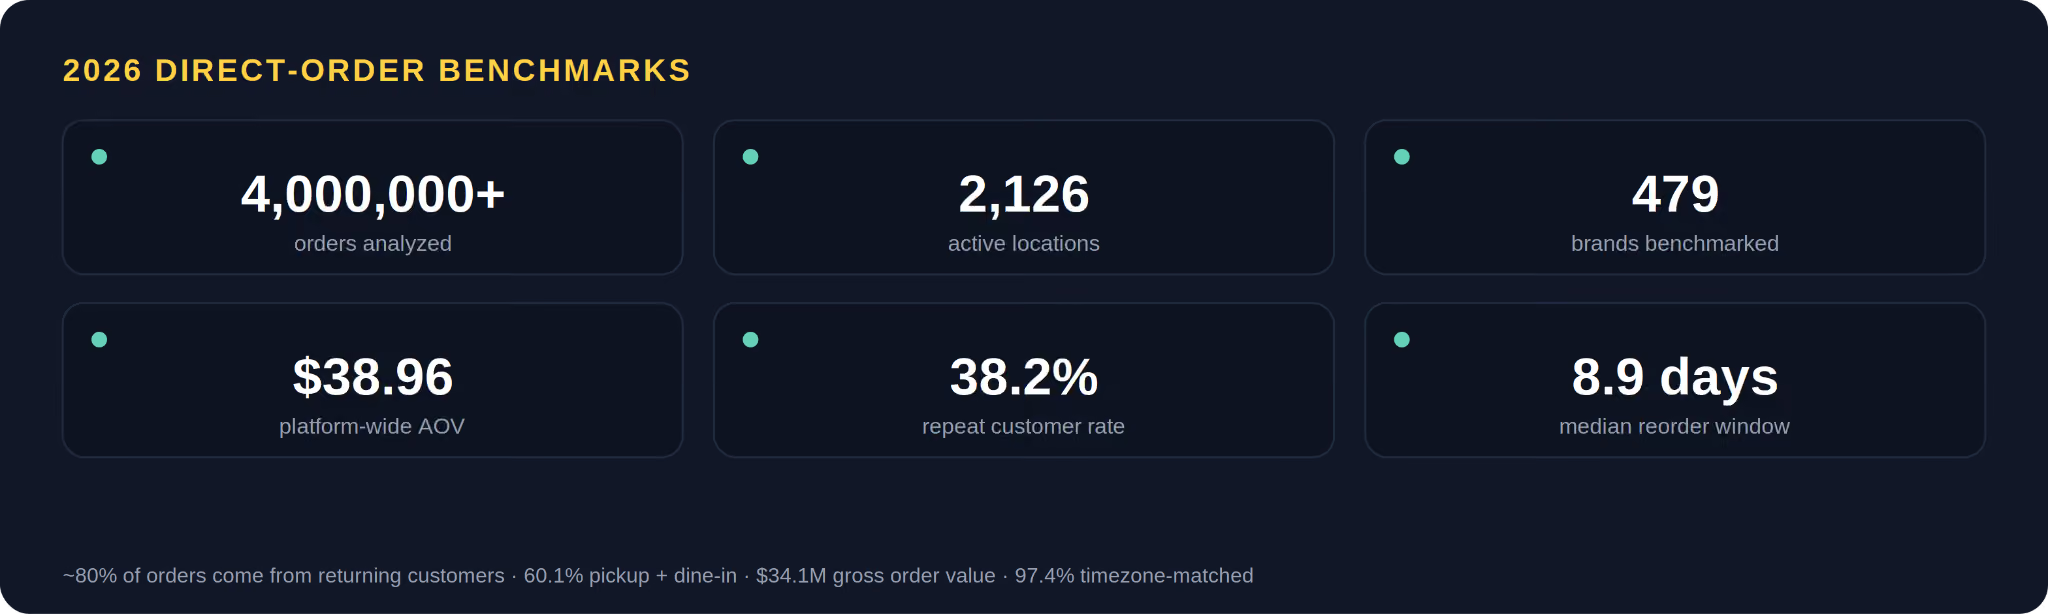
- Direct-order benchmarks from 4,000,000+ orders reveal more than broad market averages, since they reflect the timing, retention, and fulfilment behavior operators can actually control.
- Ordering peaks on Friday and falls to its weakest on Monday, with dinner from 5:30 to 8:30 PM as the clearest window for staffing and prep.
- A 38.2% repeat rate and 8.9 day median between orders make day 7 to 10 the sharpest re-engagement window, with roughly 80% of orders from returning guests.
- Pickup and dine-in lead at 60.1% versus 39.9% delivery, but the split swings by concept, from Cafe pickup above 75% to Grocery delivery at 99.8%.
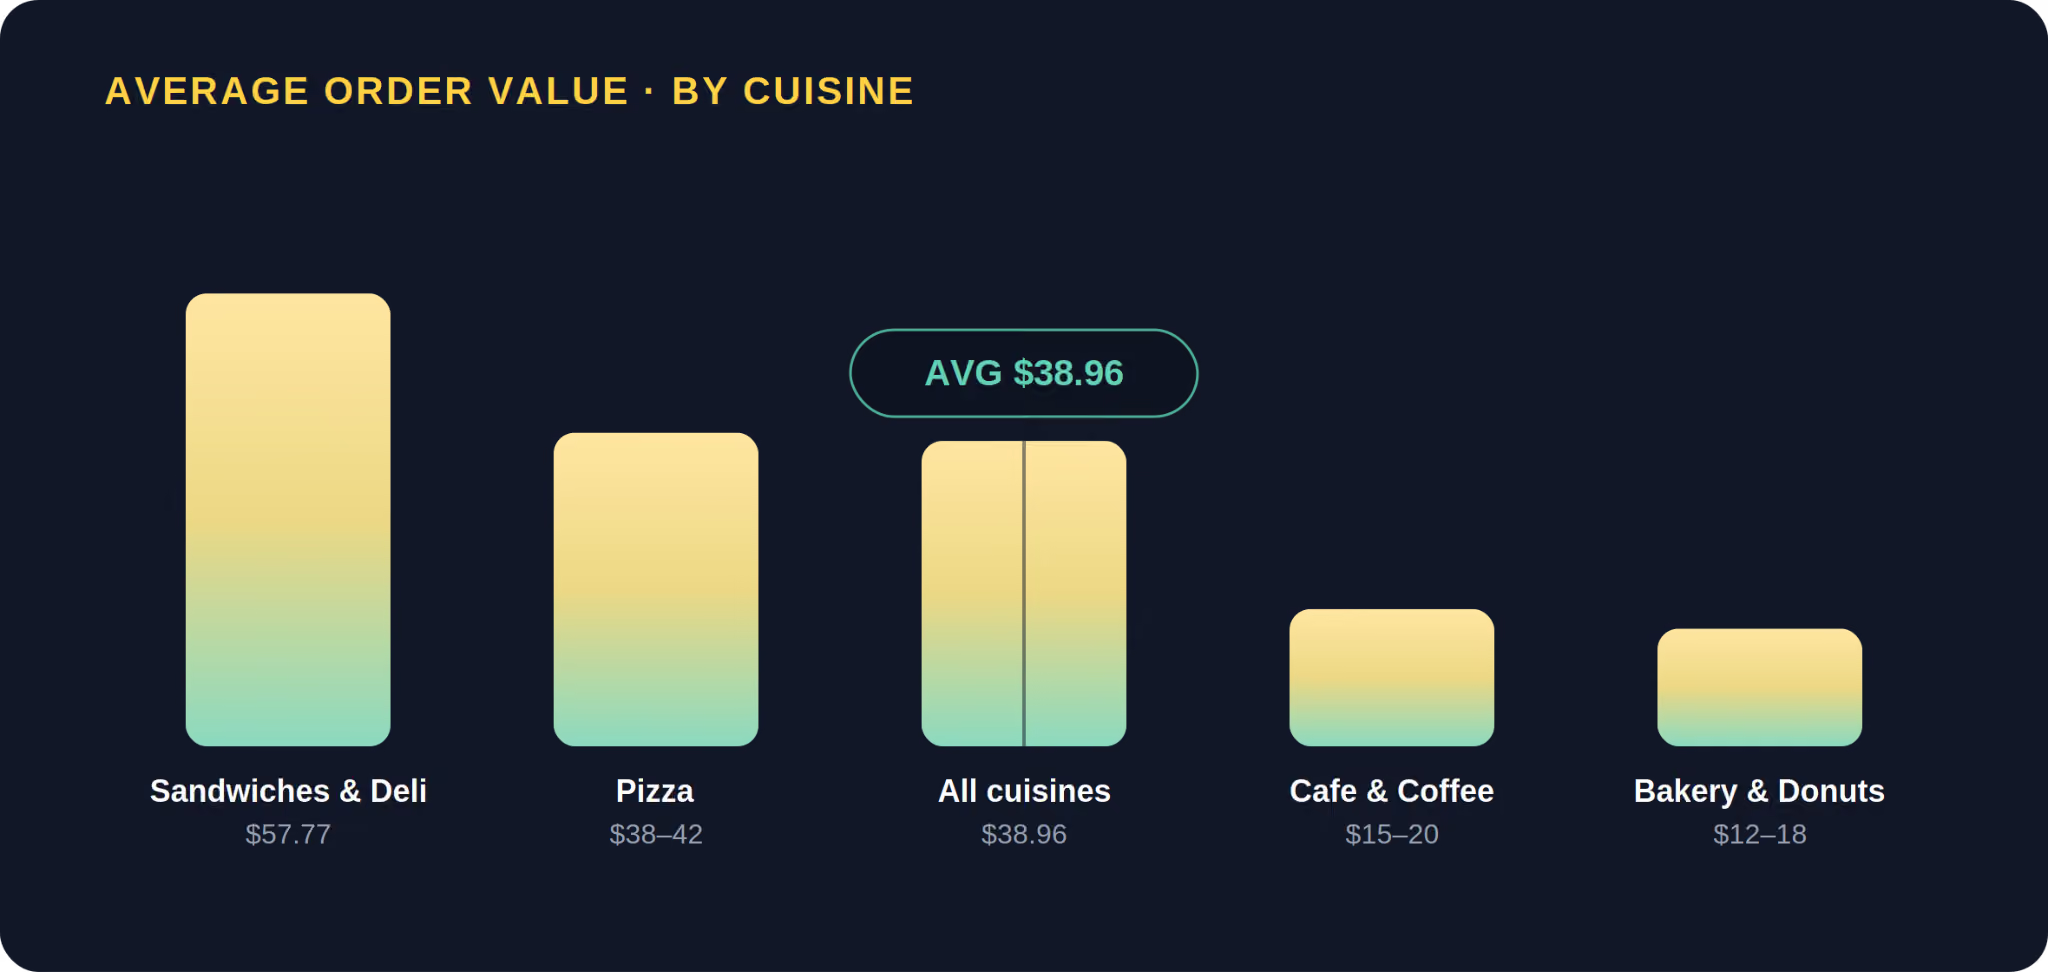
- Cuisine AOV ranges widely, from $57.77 for Sandwiches and Deli down to $12 to $18 for Bakery and Donuts, so basket goals should match category, not platform average.
- Independents can benchmark their engine against peers, while multi-location groups use the same figures to spot pickup or reorder drift before it reaches revenue.
In brief: The most useful 2026 restaurant industry comparison is not market size alone. It is whether your direct-order business is keeping pace with real ordering behavior. Our benchmark base spans 4,000,000+ orders, with a 38.2% repeat rate and 8.9 days median between repeat orders. Broad outlook reports explain the market backdrop; they rarely tell an operator whether Friday demand, pickup share, or a 7 to 10 day re-engagement window is working in their favor.
What restaurant operators want from a 2026 industry report
A useful restaurant industry report should explain where demand is headed and tell operators what to do with that information. The most valuable reports in 2026 cover traffic, sales pressure, labor, pricing, tech adoption, and off-premises growth, then translate those trends into decisions around staffing, promotions, and channel mix.
Most broad outlook pieces stay at the market level. That helps with context, but it does not tell a restaurant owner whether Tuesday lunch, Friday dinner, or late-night pizza is the more reliable profit window. The macro view and the channel view rarely move together, so operators need both.
The behavior shift toward direct ordering is one of the defining forces here. A full 67% of consumers prefer ordering directly from restaurant websites or apps, and 2026 commentary still points to value sensitivity, labor strain, and mobile-first ordering as the pressures worth planning around. The question is what those pressures do inside your own orders, not just across the industry.
Why direct-order benchmarks matter more than broad averages
The best restaurant benchmarks come from actual ordering behavior, not from broad industry averages that blur together dine-in, delivery, takeout, and marketplace traffic. When the goal is to compare your own direct-order performance, a 4,000,000+ order base is more useful than a generic market outlook.
Most industry reports explain what is happening across restaurants overall. Our data shows how those trends actually play out inside direct ordering, and that difference matters. An operator cannot adjust to a vague market forecast, but they can adjust ordering windows, basket-building, and fulfilment priorities against a real baseline.
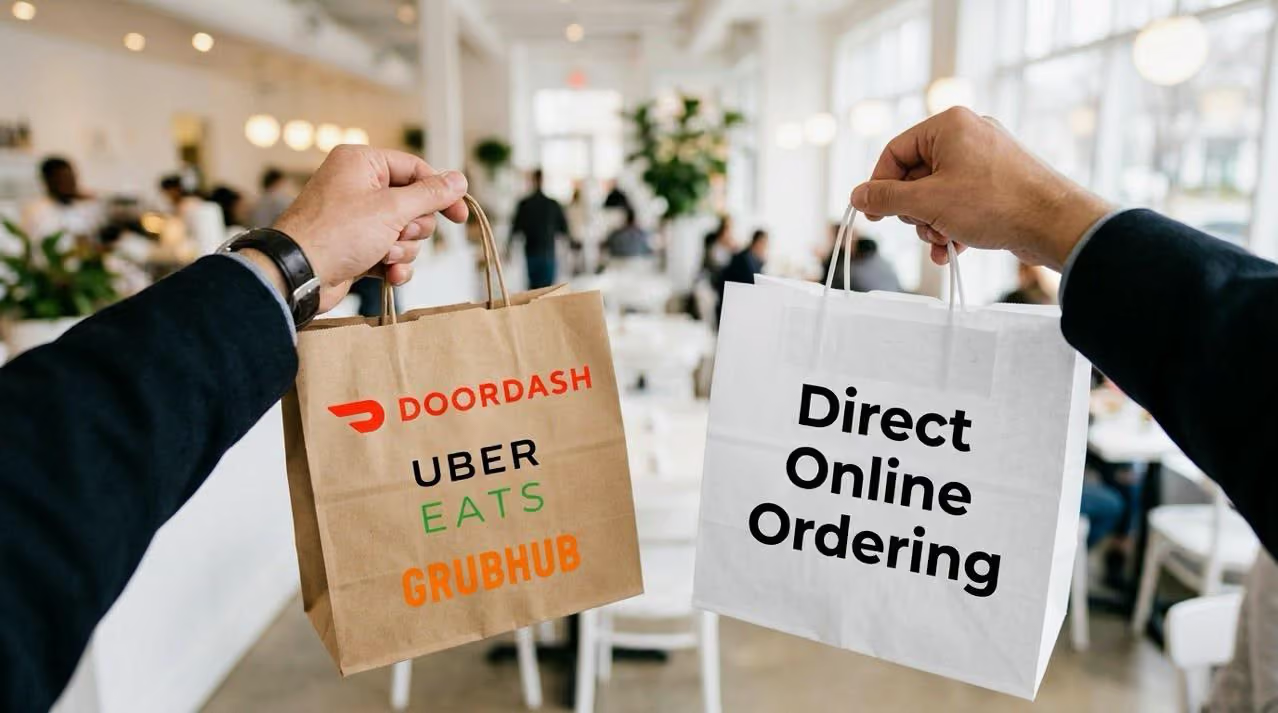
Consumer preference reinforces why branded channels deserve this level of attention. When most guests would rather order from a restaurant's own site or app, the direct channel is not a side project. It is where the most reliable data, and the most defensible margin, already live.
What the 2026 outlook means for sales, traffic, labor, and value sensitivity
The 2026 restaurant outlook points to cautious demand, price sensitivity, and labor pressure. The real question is whether your ordering data can show you where the noise is coming from. Sales can look healthy while traffic softens, especially when menu price increases quietly hide weaker visit frequency.
This is where many broad reports stop. They discuss inflation, staffing gaps, and consumer caution, then move on. For operators, those pressures change the meaning of every online order. If guests are ordering less often, or waiting for promotions before they buy, then basket value and reorder timing matter more than top-line growth alone.
The channel is large enough to reward that attention. The online food delivery market is projected to reach $198.99 billion in 2026, and restaurant tech adoption continues to center on ordering, payment, data, and automation. Reading your own numbers against that backdrop is how you tell a genuine demand problem apart from a pricing illusion.
When do restaurant orders peak during the week and day?
Ordering is not evenly distributed across the week, which means staffing and promotions should never be treated as flat planning exercises. Friday is the strongest ordering day, followed by Thursday and Saturday, while Monday is the weakest.
That pattern changes how you should use each day. The busiest day is not always the best time to discount, and the slowest day is not always the right place to cut labor too hard. The clearest peak is dinner, especially 5:30 to 8:30 PM, where prep speed, channel handoff, and menu focus have the most visible effect on service.
If you are planning promotions, the timing question deserves as much thought as the offer itself. Restolabs' restaurant marketing calendar breaks this down by concept, but the principle holds across the board: push visibility into the windows where intent is already high, and use the quiet days to protect margin.
How strong is repeat ordering in restaurant demand?
Repeat ordering is one of the clearest signs of restaurant health. It shows whether guests liked the experience enough to come back without being prompted by a marketplace or a one-time discount. Our data shows a 38.2% repeat rate over a 6-month lookback, with 8.9 days median between repeat orders.
That timing is the part operators tend to overlook. If the average return lands in under two weeks, the smartest re-engagement window is not a vague monthly campaign. It is the day 7 to day 10 range when intent is still warm. Roughly 80% of orders come from returning customers, which means retention is not a side metric. It is the engine.
Frequency compounds this. Customers who order online visit restaurants 67% more often, so a direct channel that earns repeat orders is not just protecting revenue. It is increasing how often the same guest comes back. That is why reorder cadence deserves as much attention as acquisition, and why choosing retention over acquisition tends to be the cheaper path to growth.
Should your channel strategy be pickup-first or delivery-first?
The right fulfilment strategy depends on concept economics, not on a blanket assumption that delivery always wins. Our data shows 60.1% pickup and dine-in versus 39.9% delivery, but that split changes sharply by segment.
That is the part many broad reports miss. Cafe and Coffee behaves very differently from Grocery and Convenience, and Pizza behaves differently again. If a concept is naturally pickup-led, then speed, queue management, and order accuracy matter more than chasing delivery expansion. If a concept is delivery-first, then dispatch discipline and menu design take center stage.
The lesson is to read your split against your concept, not against a platform average. A coffee shop chasing a delivery-heavy playbook will spend on the wrong problem, while a grocery concept ignoring dispatch quality will feel it in every late order.
What do cuisine-level AOV benchmarks say about basket size?
AOV benchmarks help operators see whether their basket size is keeping up with similar concepts, especially when higher menu prices can disguise weak order construction. Our data shows clear differences by cuisine: Sandwiches and Deli sits at $57.77, Pizza runs $38 to $42, while Cafe and Coffee and Bakery and Donuts occupy much lower ticket bands.
That spread matters because basket strategy should match the menu. A late-night pizza basket is not built the same way as a morning coffee order, and a deli ticket should not be judged against a bakery average. The point of the benchmark is not to chase the biggest number. It is to know whether your offer is behaving like a healthy version of its category.
Many 2026 restaurant reports note value pressure and rising discount dependence, which is exactly why basket quality and repeat behavior deserve more weight than headline sales. When guests are more price-conscious, the win is not a bigger discount. It is a smarter basket, and that is where menu design and combo strategy do quiet, durable work.
How do geography and concept type shape ordering behavior?
Geography matters because ordering habits are not identical across every market, and multi-location operators need to know where their channels behave differently. Our platform volume is notable across the United States, Europe, the United Kingdom, Singapore, the UAE, Canada, and Australia.
The practical point is not global scale for its own sake. It is that regional traffic patterns, labor expectations, and delivery habits can shift the meaning of the same benchmark from one market to the next. A repeat rate or pickup share that looks strong in one country may read differently in another. Brands operating across borders should benchmark by market before drawing conclusions from a single blended number.
How does this report help independent and multi-location restaurants?
Independent restaurants and multi-location groups both need benchmarks, but they use them differently. Independents want to know whether their direct-order engine is healthy relative to peers. Multi-location operators want to spot drift across locations, concepts, or markets before it becomes expensive.
This is where direct-order data is more actionable than a broad market summary. It reflects everyday decisions around menu design, timing, fulfilment, and customer return behavior, so operators can compare against a real ordering base instead of a generalized industry average.
For an independent, the read is straightforward: if your repeat rate trails 38.2%, or your basket sits well below your cuisine band, you have a concrete place to start. For a group, the same benchmarks become an early warning system. When one location's pickup share or reorder cadence drifts from the rest, you see it before the revenue does.
How can Restolabs help restaurants own online ordering?
A strong benchmark report should do more than describe the market. It should help restaurant teams see where their own ordering patterns are working, where they are losing momentum, and where small operational changes could have an outsized effect.
Restolabs supports restaurants that want direct control over their online ordering, customer data, and repeat business. The platform is built for operators who prefer to own the channel rather than rent it, and the 2026 Online Ordering Behaviour Report is designed to help them benchmark that channel with more confidence.
Ready to take back your online ordering? Book a Demo

Sruthi Sekar specializes in brand strategy, growth, and user experience in the hospitality industry. As the driving force behind Restolabs, she helps restaurants harness technology to scale and thrive. With a background in design, branding, and entrepreneurship, she brings a sharp focus on crafting digital experiences that drive real business impact.
Frequently Asked Questions
It should cover demand trends, value sensitivity, labor pressure, tech adoption, and channel behavior, then translate those themes into decisions operators can actually make.
Direct-order benchmarks reflect controllable behavior, including repeat rate, basket size, and fulfilment mix, rather than blending together every type of restaurant traffic.
A strong rate depends on concept and channel, but a repeat rate above 35% is generally healthy for direct ordering, especially when the time between orders is short.
In our data, Friday leads the week, Monday lags, and dinner from 5:30 to 8:30 PM is the clearest peak window.
By concept. A pickup-heavy concept needs different staffing and menu planning than a delivery-heavy one, and a platform average rarely tells the full story.
It benchmarks direct-order behavior across 4,000,000+ orders, including AOV, repeat rate, reordering cadence, fulfilment mix, and cuisine-level patterns.
They can compare their own ordering performance against a direct-order base, then use the gaps to improve retention, timing, and basket value.





.webp)

.svg)
.webp)