


Key Takeaways
- Friday is the heaviest ordering day, so labor, prep, and manager coverage should cluster at the end of the week.
- The 5:30-8:30 PM dinner window is the tightest staffing decision of the day; lunch is a real but secondary peak.
- Pickup, dine-in, and delivery do not behave the same, so one flat schedule leaves you overstaffed on slow stretches and short during the rush.
- Day 7 to 10 is the strongest window to bring repeat guests back, matching an 8.9-day median reorder gap.
- Our data across 4,000,000+ orders shows Friday leading volume, dinner peaking from 5:30-8:30 PM, and 97.4% timezone-corrected orders behind the timing readout.
Most coverage of restaurant operations stops at "weekends are busy" and "watch your labor costs." Both are true, but neither is precise enough to build a schedule on. This report ties order behavior directly to staffing, prep counts, channel handoff, and retention timing, so the next shift you write is grounded in what guests actually do.
What restaurant operators need to know about weekly demand
Friday is the highest ordering day of the week, and that single fact should shape where you build flexibility and where you refuse to cut corners.
Not every restaurant has an identical week, but the concentration is strong enough to plan around. According to our data from the Restolabs 2026 Online Ordering Behaviour Report, Friday leads ordering volume, with Thursday and Saturday following close behind. End-of-week coverage is the safest place to protect first.
Here is why "weekly trends" language is too vague to schedule against. A Friday spike does not just add a few extra tickets. It reshapes line staffing, expo coverage, prep counts, and whether a manager is actually on the floor when ticket times start slipping. Monday and Tuesday rarely force those same calls. Weekly demand is a scheduling problem, not a marketing story.
The practical move is to ramp before the peak, not during it. If Thursday already trails Friday closely, Thursday is your on-ramp: prep ahead, confirm coverage, and avoid the scramble of trying to staff up mid-rush on your busiest day.
Why dinner service needs the most labor coverage
The 5:30-8:30 PM dinner window is where staffing decisions have the most consequence, and treating it as equal to the rest of the day is where most schedules break down.
After the weekly pattern, the next question operators ask is simple: when exactly does the rush hurt most? The answer is dinner. Lunch matters, but it is the secondary window. Our data shows dinner as the main peak and lunch from 11 AM to 1 PM as the supporting one. That difference changes the shape of a shift, because a strong plan is not just more hands, it is the right hands at the right time.
Dinner pressure hits every part of the service chain at once. The host feels the wait building. The line feels the ticket rail fill. Delivery handoff feels the driver queue stacking up. A manager feels it the moment ticket times start sliding past target. If you are still staffing evenly across the day, you are almost certainly overstaffed in the quiet mid-afternoon and underprepared when the floor turns.
The fix is to concentrate labor where the curve is steepest and thin it where the curve is flat. That is a cost decision as much as a service one, which the sections below make concrete.
For deeper tactics on peak-hour service and pacing, the Restolabs restaurant operations tips guide expands on this.
How timezone-matched orders make the timing data reliable
A timing readout is only useful if it lines up with local service hours, and 97.4% timezone correction is what makes the weekday and daypart pattern trustworthy enough to schedule against.
Here is the problem that correction solves. If orders are not aligned to local time, Friday evening in one market can blur into Saturday morning in another. Aggregate that across thousands of locations and your "dinner peak" turns into noise that no one can staff to. That is why the methodology matters here, even for readers who never think about methodology.
The practical version is straightforward. You do not need a statistics lesson. You need confidence that a Friday dinner spike is actually a Friday dinner spike in your dining room, not an artifact of mismatched clocks. Our data corrects for local time on the overwhelming majority of orders, which is exactly what makes the rest of this report usable for shift design, prep planning, and coverage decisions.
What labor market pressure means for peak planning
Knowing when demand arrives is only half the problem. Turnover, labor cost, and persistent staffing gaps still make peak coverage hard to execute, which is why precise demand planning matters more now than it did a few years ago.
It is not enough to know Friday is busy if your team is stretched, short a cook, or expensive to schedule into overtime. The external labor picture makes the stakes clear. The restaurant industry has run a 79.6% average annual turnover rate over the past decade, which means constant retraining and scheduling instability, precisely the conditions that make a stable Friday dinner crew hard to hold together.
Cost is the other side of that equation. Labor reached a 36.5% median share of sales in recent reporting, so overstaffing a weak day damages margin as fast as understaffing a rush damages service. Peak-hour staffing is a margin decision, not just a service one. The smarter move is to align labor to the order curve first, then protect your highest-pressure windows before anything else.
Hiring alone does not close the gap either. Bars and restaurants added roughly 150,000 jobs in 2025, yet table-service restaurants remain 233,000 positions below pre-pandemic levels. The industry is still hiring and still short-staffed at the same time. That combination is exactly why forecasting to real order timing beats scheduling by habit.
If labor cost is your pressure point, the Restolabs guide to reducing restaurant labour costs pairs well with this data.
What the fulfillment mix says about prep and staffing
Pickup, dine-in, and delivery need different pacing models, and the 60.1% to 39.9% split is the clearest sign that building your whole operation around delivery leaves real volume underserved.
Channel mix is an operations signal, not just a sales split. When pickup and dine-in make up the majority of orders, your front counter, expo, and handoff flow have to be built for that reality. According to our data, 60.1% of orders were pickup plus dine-in, while 39.9% were delivery. A kitchen tuned only for delivery dispatch will fumble the counter rush, and vice versa.
Cuisine changes the math again. Our data shows the mix varies sharply by concept, which means you cannot copy another restaurant's labor plan and expect the same result. A pickup-heavy pizzeria, a delivery-first ghost kitchen, and a dine-in casual spot will all feel Friday night differently. Grocery and convenience orders, for example, run 99.8% delivery, so a delivery-native model needs a completely different staffing logic than a counter-service concept.
The practical read is to build your prep timing and station assignments around your actual mix. If most of your volume walks in for pickup, protect the counter and expo. If delivery leads, protect packaging, dispatch timing, and driver handoff so orders leave hot and on time.
When repeat customers are most likely to order again
Day 7 to 10 is the strongest window to re-engage repeat guests, because that is when they sit closest to placing their next order.
Retention data turns into a simple operator action here. According to our data, the median gap between repeat orders is 8.9 days. That timing is specific. Messaging on day one or day two is usually too early, since the guest is not thinking about their next order yet. Wait too long and you miss the moment intent is strongest. The sweet spot lands around day 7 to 10, right as the median reorder gap comes due.
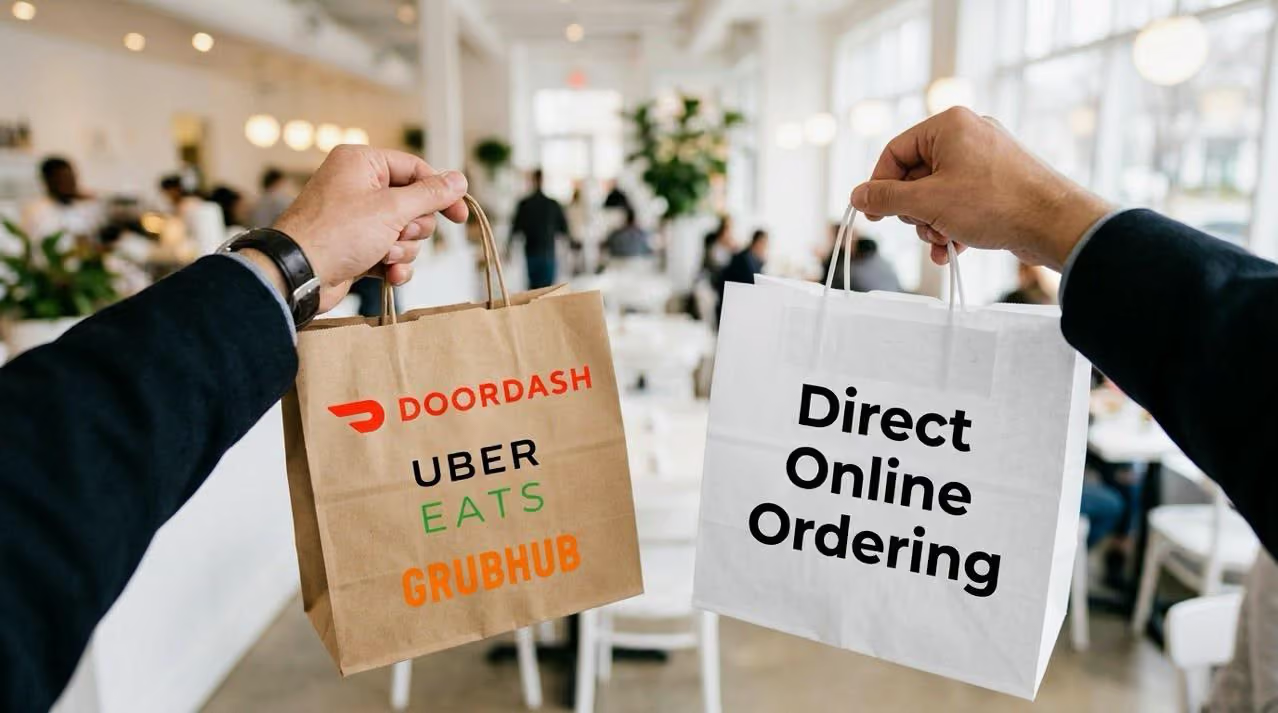
This connects back to owning your order channel. A restaurant that controls its own ordering relationship can time outreach around known behavior instead of guessing when guests might return. The same weekend rhythm that drives your staffing also shapes when a well-timed email, push, or SMS lands best. With a 38.2% repeat customer rate in the mix, a disciplined day 7 to 10 nudge is one of the cheapest ways to protect volume on your busiest days.
How Restolabs Helps Restaurants Own Direct Ordering
Restaurants that own their ordering channel can use their own timing data to staff better, prep smarter, and bring guests back on schedule.
Direct ordering gives operators a cleaner view of volume, daypart, and repeat behavior, and that view is what makes the rest of this report easy to act on. When the same platform that takes the order also shows you when Friday demand begins, which service window is under the most strain, and when repeat guests are due back, the next scheduling decision gets a lot simpler.
Restolabs builds that ownership into a commission-free online ordering system with full access to your own customer data. That is the real value of owning the channel: the numbers behind this report become your numbers.
Ready to take back your online ordering? Book a Demo

Sruthi Sekar specializes in brand strategy, growth, and user experience in the hospitality industry. As the driving force behind Restolabs, she helps restaurants harness technology to scale and thrive. With a background in design, branding, and entrepreneurship, she brings a sharp focus on crafting digital experiences that drive real business impact.
Frequently Asked Questions
Friday is the strongest demand day in the data, so it is the clearest signal for labor, prep, and manager coverage decisions.
The 5:30-8:30 PM dinner window should carry the strongest staffing plan because it is the main peak across all dayparts.
Yes, but it is a secondary peak compared with dinner, so it usually needs lighter coverage than the evening rush.
The data uses 97.4% timezone-corrected orders, which makes the weekday and daypart pattern dependable enough for real planning decisions.
It means labor, handoff, and prep should be built around the actual channel mix for your concept, not delivery alone.
Day 7-10 is the strongest re-engagement window because it aligns with the 8.9-day median reorder gap in the data.
It ties ordering behavior to staffing, prep planning, channel mix, and retention timing rather than staying at a broad industry level.






.webp)

.svg)
.webp)