

.avif)
Key Takeaways
- The "90% fail" line is a myth. Public 2025 to 2026 figures put first-year failure closer to 14% to 17% for full-service restaurants, with roughly 83% surviving year one.
- Restaurants rarely close because of one big mistake. They close when thin margins, weak cash flow, and slow repeat business stack up faster than revenue can absorb.
- The second order is the real survival signal. If guests do not return within the first week or two, the odds of building durable revenue drop fast.
- Commission-heavy channels quietly erase margin at the exact stage when a new restaurant can least afford it.
- Our Mar 2025 to Mar 2026 data shows a 38.2% repeat customer rate, an 8.9-day median reorder window, and roughly $8M to $10M in commission savings versus 25% to 30% third-party commission drag.
Most searches for "restaurant failure rate" start from fear, usually a half-remembered statistic that nine out of ten restaurants close in year one. The number is wrong, and chasing it distracts from the question that actually decides whether a new restaurant makes it: does enough margin and repeat demand survive the first few months to keep the doors open?
What is the real restaurant failure rate?
The often-repeated "90% fail in year one" figure is a myth. Real first-year failure for full-service restaurants sits around 14% to 17%, based on widely cited BLS-linked data, which puts year-one survival at roughly 83%. Datassential's 2025 tracking recorded a first-year failure rate of just 0.9% across monitored units, the lowest since 2018. Broader industry summaries still float a 30% average first-year estimate.
Those numbers are not a contradiction. They reflect different sample sizes, business categories, and reporting years. Some sources track only full-service restaurants, others fold in accommodation businesses, and a few measure only the units on their own sales platforms.
Looked at from the survival side: roughly 83% survive year one, about 70% reach three years, and around 50% reach five years. Opening is survivable for most restaurants. Staying open is a slower fight, and that is where the headline failure rate stops being useful.
The useful question is not how many restaurants close. It is what quietly erodes survival after the launch buzz fades.
Why do restaurants fail after year one?
Most restaurants do not fail because one thing goes wrong. They fail when thin margins, weak cash flow, and inconsistent repeat business stack up faster than revenue can absorb them.
The familiar causes are real: a location that draws the wrong foot traffic, a concept that never clicks with the neighborhood, labor strain that eats into service quality, food cost drift that nobody catches until the monthly numbers arrive. But underneath most of those stories is the same quiet problem: margin leakage. A restaurant can look busy, post respectable order counts, and still be fragile if each ticket carries too little contribution margin to cover the next payroll run.
This is where the first year plays a trick on owners. Early demand, the opening crowd, the local press, the friends and family, can mask the math for months. The dining room feels alive. Then the balance sheet catches up. U.S. Bureau of Labor Statistics and National Restaurant Association closure data both point in the same direction: businesses that cannot convert activity into retained margin run out of runway before the concept has a chance to mature.
Most industry articles frame failure as a marketing or location problem. The order data tells a quieter story. Survival is less about launch excitement and more about whether each ticket actually leaves room to breathe.
Why do repeat orders matter more than first orders?
The first order gets the attention, but the second order tells you whether a restaurant is becoming a habit instead of a one-time visit. Repeat behavior predicts survival far better than raw opening traffic.
A packed opening week measures curiosity, not loyalty. The signal that matters is whether those first-time guests come back soon enough to prove the concept fits and to build revenue you can actually plan around.
According to our data from the Restolabs 2026 Online Ordering Behaviour Report, the retention picture is clear. The platform-wide repeat customer rate is 38.2%. Customers place an average of 3.2 orders, with an average lifetime spend of $123.79. Most striking for anyone worried about survival: returning customers drive roughly 80% of all orders.
Timing is the part owners tend to miss. If a guest does not reorder within the first 7 to 10 days, the relationship gets much harder to recover. The window closes quietly, and a restaurant that keeps chasing new first-time traffic to replace guests who never came back is running on a treadmill it cannot afford.
Watch reorder timing as closely as you watch daily sales totals. A strong retention loop is cheaper and more durable than a constant hunt for new faces.
Where do delivery and commission fees drain margin?
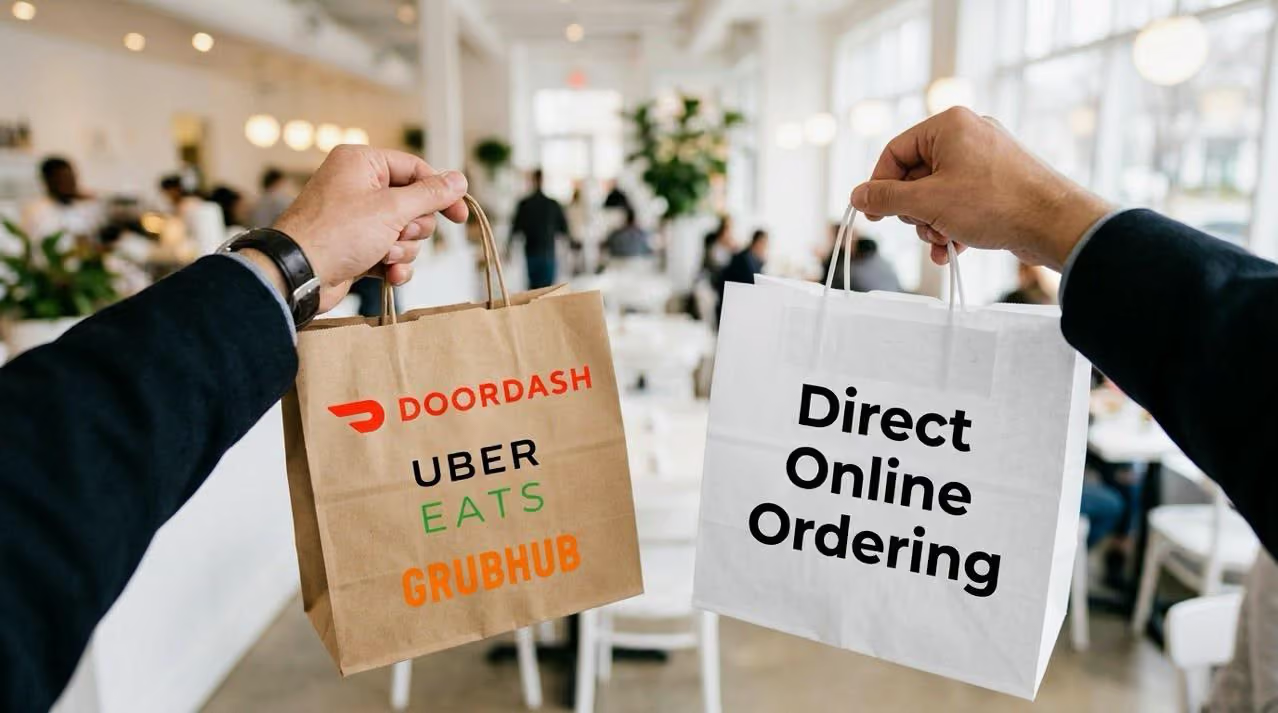
A restaurant can sell plenty of food and still lose survival leverage if too much of each ticket disappears into commission-heavy channels. Fee structure decides how much of every sale you actually keep.
The math is unforgiving when a business is still fragile. Third-party commissions in the 25% to 30% range come off the top, before labor, before food cost, before any reinvestment. Every percentage point taken there is a percentage point that cannot cover the parts of the business that keep it running.
According to our data, the scale of what stays in the business through direct ordering is significant. The platform processed $34.1M in commission-free gross order value from March 2025 to March 2026. Against a 25% to 30% third-party commission benchmark, that represents an estimated $8M to $10M kept by restaurants rather than surrendered to marketplace fees. On the direct side, the average fee applied was $2.26, delivery-fee revenue passed $3.2M, and a fee range of $1 to $15 covers 95% of fee orders.
This is the part fee drag hides best. A restaurant can post a healthy-looking order count and still be quietly starving because the volume flows through a channel that keeps a quarter or more of every ticket. The difference between direct ordering and marketplace dependence is not a feature preference. It is the difference between building margin order by order and renting your own customers back at a premium. In the first year, when the cushion is thinnest, that gap decides who gets to stay open.
When is the reorder window most critical?
The first week after a purchase is not a warm-up period. It is the moment when repeat behavior is most likely to form or disappear, which makes days 7 to 10 the practical reset point for any new restaurant.
According to our data, the median gap between repeat orders is 8.9 days. That number turns the first reorder cycle into a survival signal rather than a marketing footnote. A guest who is going to become a regular usually shows it inside that window. A guest who drifts past it is already harder to win back.
The optimal re-engagement window sits at day 7 to 10, right on top of that median interval. Our data flags rising churn risk at day 30 and beyond across every channel. A restaurant that only reaches out at the 30-day mark is not re-engaging a warm guest. It is trying to resurrect a cold one.
The link to survivability is direct. The guest who does not return quickly is not just a lost order this week. They are a lost stream of the 3.2 orders and $123.79 in lifetime spend that returning customers represent. Miss the window often enough, and the retention math that keeps a restaurant alive never gets a chance to work.
How should owners read survival risk in the first 30 days?
Track the signals that predict future cash flow, not just the headline number of orders. The first 30 days are a diagnostic period, and the right metrics reveal fragility long before the bank balance does.
A strong day-one crowd can hide a weak business. The more honest read comes from watching a small set of behaviors: repeat share, reorder interval, fee drag, delivery dependence, and returning-customer mix. Those five together tell you whether early demand is turning into a durable engine or just a spike.
According to our data, the benchmarks are worth measuring against. The platform processed more than 4,000,000 total orders from March 2025 to March 2026, at a platform-wide average order value of $38.96. Fulfillment split 60.1% pickup and dine-in versus 39.9% delivery, and the repeat customer rate held at 38.2%.
A restaurant tracking well below the repeat rate, or leaning heavily on the delivery side of that split, is carrying more risk than its order count suggests. The ordering behaviour report is a useful deeper benchmark for owners who want to compare their own numbers. Survival, in practice, is built from a few measurable behaviors, not one lucky launch.
How Restolabs helps restaurants own direct ordering
Restolabs is a direct-ordering system built to reduce commission dependency and keep more of each sale inside the business, which is exactly the margin most first-year restaurants cannot afford to lose.
The survival math in this article keeps returning to the same points: keep margin, earn the second order quickly, and stop leaking a quarter of every ticket to fee-heavy channels. Direct ordering supports all three. Restolabs gives restaurants ownership of their customer data, so the reorder window can actually be worked instead of ignored. Plans are contract-free, which matters when a young business needs flexibility rather than a lock-in. And setup is fast enough to start selling directly without a long, expensive rollout.
None of that guarantees survival. But it protects the margin and the customer relationships that survival depends on, at the stage when both are most fragile.
Ready to take back your online ordering? Book a Demo

Sruthi Sekar specializes in brand strategy, growth, and user experience in the hospitality industry. As the driving force behind Restolabs, she helps restaurants harness technology to scale and thrive. With a background in design, branding, and entrepreneurship, she brings a sharp focus on crafting digital experiences that drive real business impact.
Frequently Asked Questions
The number changes by source. Full-service restaurants show roughly 14% to 17% first-year failure in BLS-linked data, while some 2025 tracking reports as low as 0.9% for monitored units and broader summaries cite a 30% average. The more useful view is the closure range plus the operating conditions behind it, not one viral percentage.
Public 2025 to 2026 summaries put five-year survival around half of restaurants, with roughly 83% surviving year one and about 70% reaching three years. Category and sample shift the exact figure. Margin discipline and repeat demand shape which side of the line a given restaurant lands on.
Traffic alone is not enough. If labor, food cost, rent, and commission drag leave too little margin on each ticket, a busy-looking restaurant can still run out of cash. Contribution margin per order, not raw order count, is what keeps the doors open.
Commission-heavy channels can take 25% to 30% off the top of every order, before any operating cost is covered. That drag hits hardest when a business is fragile. Direct ordering protects contribution margin at exactly the stage when survival is most at risk.
Repeat orders prove a concept can become a habit, and they create the lifetime value that stabilizes revenue. Our data shows returning customers drive roughly 80% of orders, at 3.2 orders and $123.79 in lifetime spend per customer. That is the engine survival runs on.
Our data shows a 8.9-day median interval between repeat orders, with the strongest re-engagement window around day 7 to 10. Churn risk rises sharply at day 30 and beyond. The first reorder cycle is a survival signal, not just a marketing metric.
Direct ordering does not guarantee survival, but it helps preserve the margin a restaurant needs to stay open. By reducing commission dependency and giving owners the customer data to earn the second order quickly, it protects the two things that first-year survival depends on most.






.webp)

.svg)
.webp)