

.jpg)
Key Takeaways
- Pizza is the top cuisine in Restolabs ordering data, with 1.35M orders and about 29-30% platform share.
- Pizza orders peak during the 5:30-8:30 PM dinner rush and again in a delivery-heavy 9:00-11:00 PM late-night window.
- Friday is the highest ordering day for pizza, followed by Thursday and Saturday.
- Pizza is a balanced fulfilment category, with about 40% pickup and about 40% delivery.
- Pizza has a $38-42 average order value, and repeat ordering is important because returning customers account for about 80% of orders overall.
Why does pizza lead online ordering volume?
Pizza leads online ordering because it holds the highest volume by a wide margin, which makes its pattern the clearest benchmark for direct demand, pricing, and channel planning.
When one cuisine commands roughly 30% of platform orders, its rhythm becomes more useful than a generic food delivery trend line. If you run a pizzeria, or a menu with pizza as a core category, this is the number that tells you whether your online ordering setup is keeping pace with real demand.
Most broad industry coverage talks about market growth in the abstract. Our data is more specific, and that specificity is what actually helps an operator plan. The pizza category is large enough to shape staffing, menu engineering, and how you own the customer relationship, not just raw order counts.
The broader industry backs this up. Roughly 84% of pizzeria operators report sales from online ordering, averaging 26.9% of total sales, which aligns with the platform share we see. Pizza sets the standard for how customers expect to order online, so treating it as a side category means missing the cuisine that trains customer behavior at scale.
You can dig into the wider cut in the Online Ordering Behaviour Report.
When do pizza orders peak?
Pizza peaks twice: the main dinner rush from 5:30-8:30 PM and a delivery-heavy late-night window from 9:00-11:00 PM, with Friday the strongest day, followed by Thursday and Saturday.
This is where pizza looks different from many other cuisines. A lot of restaurants assume late-night ordering is a minor tail on the day. Our data shows it is a real demand pocket, especially for delivery. That means the last two hours of the night are not simply about staying open longer. They capture incremental orders that may never appear during the dinner rush.
If you staff pizza the same way you staff a lunch-heavy menu, you are probably leaving money on the counter. The Friday spike tells you where pressure lands first, but the Thursday and Saturday follow-on means demand is broad enough to support a deliberate weekly schedule rather than a single peak-day plan.
Consumer behavior reinforces this shift. Around 64% of consumers prefer placing pizza orders digitally for delivery or takeout, which is why that late-night window shows up so clearly in digital order data. The practical read is simple: keep inventory and kitchen pacing ready for the dinner wave, then decide whether extended hours are worth it based on the orders that actually arrive after 9 PM, not on gut feel.
Is pizza mostly delivery or pickup?
Pizza is unusually balanced. Our platform-wide mix is 60.1% pickup plus dine-in and 39.9% delivery, while pizza itself runs about 40% pickup, making it a flexible fulfilment category rather than a delivery-only one.
This matters because pizza is often described as if delivery is the whole story. It is not. A near-balanced mix means pickup can be just as operationally important as delivery, especially once margin, speed, and labour enter the same conversation.
For operators, that balance changes how the ordering experience should be framed. If pickup is already close to delivery in importance, it should not be buried under a delivery-first flow. It should be visible, fast, and easy to choose, because customers are already comfortable using it.
The operational upside is real. Balanced fulfilment gives restaurants room to protect margin through pickup, reduce courier dependence, and keep more control over order timing. That control is especially valuable during high-pressure evening periods, when delivery demand spikes and kitchen flow needs to stay predictable.
What does pizza AOV say about basket size and margins?
Pizza sits in a healthy middle-ticket band at a $38-42 average order value, high enough to support bundles, add-ons, and family-style orders while staying accessible enough to keep demand broad.
Average order value is one of the most overlooked numbers in online ordering. Volume looks impressive, but basket size tells you whether the category can carry real margin after labour, packaging, and delivery costs. Pizza lands in a useful range. It does not behave like a low-ticket snack category, yet it is not locked into premium pricing either.
That balance gives operators options. You can build value around combinations, size upgrades, and side items without pushing the order into a price band that feels inflated. For many restaurants, that is the sweet spot: enough ticket value to make the economics work, enough familiarity to keep conversion high.
External pricing pressure reinforces the point. With food-away-from-home prices predicted to rise 3.6% in 2026, a basket in this range gives restaurants room to protect margin while staying within a customer's expected spend. Set against a global pizza market projected to reach USD 234.1 billion in 2026, the category has room to move on price without losing demand, which is exactly why it works so well as a benchmark cuisine.
Why do repeat orders matter so much for pizza?
Pizza is a repeat-heavy category. Returning customers make up about 80% of orders overall, the median gap between repeat orders is 8.9 days, and day 8 to day 10 is the strongest window to re-engage.
If pizza sells well once, it often sells well again soon. That is why the first order should not be treated as the finish line. The real value builds when a restaurant catches the next order before the customer drifts into inactivity or defaults to a competitor.
Many ordering strategies chase new customers and then stop. For pizza, that misses the most efficient part of the revenue curve. When repeat behavior is already strong, the smartest move is to stay visible in the short window before the next order decision gets made somewhere else.
The timing tells you when to act. Day 8 to day 10 is the natural nudge point, day 14 and beyond becomes win-back territory, and day 30 plus is where churn risk starts to feel real. That structure makes owned channels especially valuable for pizza operators, because the channel can carry the next prompt without paying for another round of marketplace-style acquisition. For a deeper look at holding onto customers, the case for customer retention over acquisition applies directly here.
How should restaurants use these pizza stats in hours and channel strategy?
The stats point to a clear operating plan: protect Friday, extend late-night coverage where demand supports it, keep pickup prominent, and use owned channels to bring customers back around day 8 to day 10\.
Pizza does not ask restaurants to choose one fulfilment mode or one daypart. It asks them to build around a rhythm. Dinner still matters, late-night matters more than many operators expect, and pickup remains a genuine part of the margin story.
For independent restaurants, that means hours and staffing should follow demand concentration rather than a fixed schedule that ignores Friday and the late-night pattern. For multi-location operators, the same data guides store-level labour planning, menu visibility, and repeat-order messaging across sites.
The strongest move is to treat pizza as a direct-ordering category first. The goal is not only to catch orders. It is to own the customer relationship that comes with them, then use timing, pickup, and re-engagement to keep volume flowing through channels the restaurant controls. The full detail lives in the Online Ordering Behaviour Report.
How does Restolabs help restaurants own pizza online ordering?
Restolabs gives restaurants a way to keep pizza orders on owned channels, where the customer relationship, order data, and repeat opportunities stay in the restaurant's hands. That matters most for categories like pizza, where timing, pickup, and repeat behavior shape the full revenue picture.
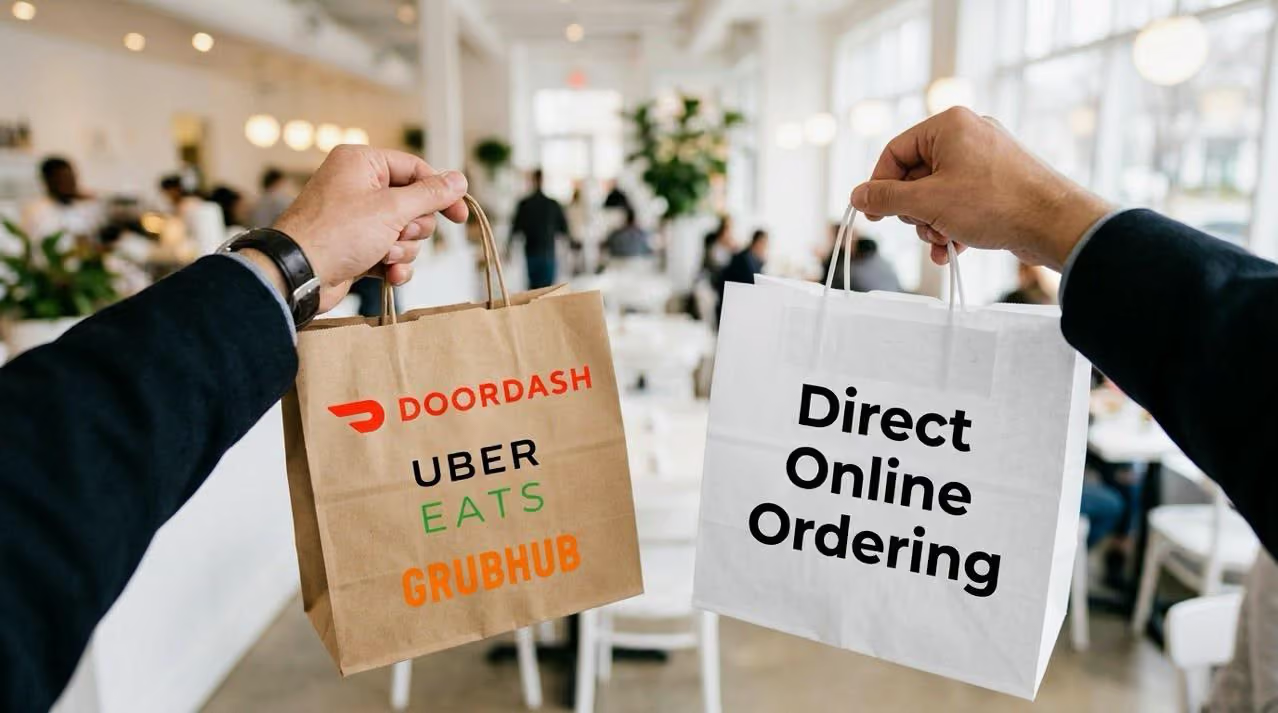
For operators who want a cleaner path from first order to repeat order, Restolabs supports direct online ordering without the drag of commission-based dependence. It is built for restaurants that want to simplify digital ordering, protect margin, and keep control of customer data while staying flexible as demand shifts across dayparts and days of the week.
Ready to take back your online ordering? Book a Demo

Sruthi Sekar specializes in brand strategy, growth, and user experience in the hospitality industry. As the driving force behind Restolabs, she helps restaurants harness technology to scale and thrive. With a background in design, branding, and entrepreneurship, she brings a sharp focus on crafting digital experiences that drive real business impact.
Frequently Asked Questions
Our data shows 1.35M pizza orders, which makes pizza the top cuisine by volume in the report.
Pizza accounts for about 29-30% of platform share, making it the clearest high-volume benchmark for restaurant ordering.
Pizza peaks during the main dinner window from 5:30-8:30 PM, then again in a late-night 9:00-11:00 PM delivery-heavy slot.
No. Pizza is a balanced fulfilment category, with about 40% pickup and a meaningful delivery share as well.
Pizza sits at a $38-42 average order value, which places it in a strong middle-ticket range for menu planning and margin management.
Returning customers make up about 80% of orders overall, and the median repeat gap is 8.9 days. That makes day 8 to day 10 a critical re-engagement window.
The full Online Ordering Behaviour Report 2026 is the best place to review the wider pizza cut and compare it with other cuisine patterns.






.webp)

.svg)
.webp)