

.jpg)
Key Takeaways
- Yes, the restaurant industry is growing in 2026, but growth is uneven across formats, channels, and dayparts.
- Nominal sales growth of about 4.8% looks stronger than the roughly 1.3% real growth once inflation is stripped out.
- Limited-service, quick-service, pickup, and delivery-native formats are carrying more of the momentum than full-service dining alone.
- Retention is a growth engine, not a side metric, so the second and third order matter as much as the first.
- Our data shows the same pattern inside owned ordering: 4,000,000+ orders, $34.1M GOV, and 2,126 active locations across 479 brands.
Is the restaurant industry growing?
Yes, the industry is still expanding in 2026, but the growth story looks different once you separate price inflation from real demand and then compare formats.
Restaurant and foodservice sales continue to rise in 2026\. The more useful question for operators is where that growth is actually happening and whether it is worth chasing in channels they own.
Most coverage stops at the headline number. That misses the view that actually helps a business plan. A restaurant can sit inside a growing market and still feel flat if traffic is soft, delivery fees are heavy, or repeat ordering is weak.
The cleaner way to read growth is through order volume, gross order value, and repeat behavior, not just broad market size. Our data from the Restolabs 2026 Online Ordering Behaviour Report shows measurable demand inside owned ordering channels, which is where margin is actually protected.
What is the restaurant industry growth rate?
The headline growth rate is positive, but nominal growth runs well ahead of real growth because rising prices are doing part of the work.
Public forecasts point to roughly 4.8% nominal sales growth in 2026, lifting U.S. restaurant and foodservice sales to about $1.55 trillion. Real growth is closer to 1.3% after inflation is stripped out. That gap tells operators that higher revenue does not always mean more guests.
If menu prices rise faster than traffic, sales can look healthy while the underlying business stays under pressure. Employment adds to the case for expansion, with about 15.8 million restaurant jobs expected by end of 2026, but headcount is not the same as guest count.
For operators, the most useful growth rate is the one tied to order count, average ticket, and repeat frequency. Our data supports that framing: across the platform, brands averaged 284 orders per brand per month, and 97.4% of orders were timezone-matched, which keeps the volume signal clean.
Growth rate comparison
Which restaurant segments are growing fastest?
Limited-service, quick-service, delivery-native, and convenience-led formats are carrying more of the growth than traditional dine-in alone.
The restaurant industry is not growing in a single line. Full-service, limited-service, quick-service, delivery, takeaway, pickup, and cloud kitchens are all participating, but not in the same way. Limited-service and quick-service models benefit from speed, lower friction, and stronger off-premises demand, while full-service growth leans more on labor and dine-in traffic.
Category mix and what it suggests
If a restaurant is deciding where to lean, segment choice changes the entire growth plan. A pizzeria, a breakfast cafe, and a deli do not scale the same way, and the data makes that obvious. Growth becomes easier to read when operators study their own category behavior before copying a generic industry trend.
What demand patterns actually drive restaurant growth?
Growth is also a timing problem, because the strongest operators meet demand at the right day, hour, and season instead of treating every hour the same.
Most articles talk about market expansion without explaining when customers actually order. That leaves operators guessing on staffing, promotions, and prep. Our data shows clear concentration: Friday is the highest ordering day, Thursday and Saturday follow, and Monday is the weakest. Dinner from 5:30-8:30 PM is the largest peak, while weekend mornings matter most for coffee and bakery demand.
Timing matters as much as market size. Q1 and Q3 are the strongest order-volume periods, while mid-year dips are real enough to affect labor plans and campaign timing. A restaurant chasing growth does not only need more demand. It needs more demand at the moments that already convert best.
Timing patterns to plan around
How important is retention to restaurant growth?
Retention is a growth engine, not a side metric, because most orders come from returning guests and the repeat cycle is short.
Chasing only new customers makes growth expensive fast. Our data shows that roughly 80% of orders come from returning customers, with a 38.2% repeat customer rate, 3.2 orders per customer, and an 8.9-day median gap between repeat orders. That short cycle means restaurants have a real chance to shape the next purchase before attention fades.
A customer who buys on Friday is still warm a week later, but the window narrows quickly. Day 7 to 10 is the best re-engagement moment. Day 14 and beyond starts to look like win-back territory. Day 30 and beyond is where churn becomes a real risk. Growth is not just about the first order. It is about getting the second and third one on a predictable rhythm.
Repeat-order window comparison
Operators who treat customer retention as a priority over acquisition tend to grow with less marketing spend, because a warm base reorders on a predictable rhythm.
Why does delivery growth look different from dine-in growth?
Delivery is growing, but not evenly. Some categories are delivery-native while others still win mainly through pickup and dine-in.
That spread matters because delivery changes economics. Fees, prep timing, order size, and customer expectations all shift once delivery becomes the dominant channel. National figures reinforce the structural move off-premises, with roughly 75% of restaurant traffic now happening off-premises. The average delivery fee in our data is $2.26, and free delivery makes up about 77% of orders, so operators should judge growth against margin, not just order count.
Fulfillment mix by category
For most restaurants, the real decision is not delivery versus dine-in. It is which category, daypart, and channel mix can grow without eroding profit.
How does Restolabs help restaurants own growth?
Growth matters most when restaurants can capture it directly, keep the customer relationship, and avoid paying away margin on every order.
Restolabs helps restaurants turn market growth into owned demand instead of rented demand. That matters more in a market where the headline numbers are rising but the real gains depend on repeat behavior, channel control, and keeping more of each sale.
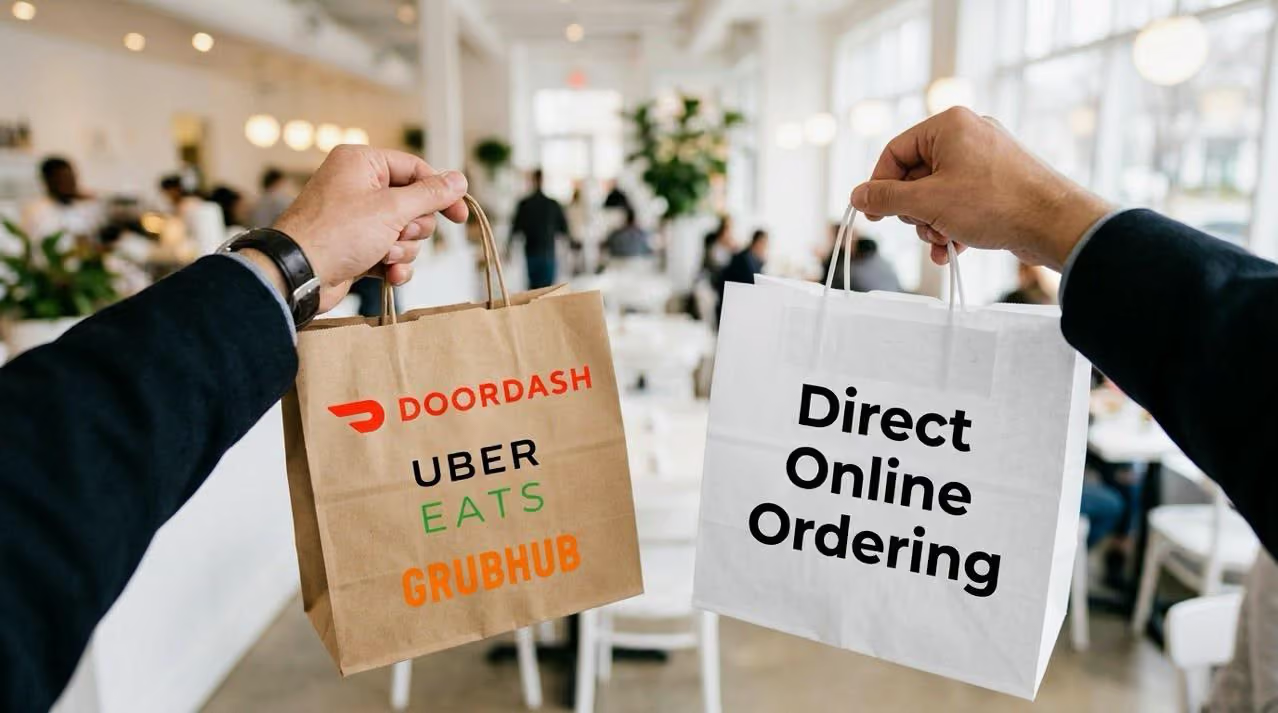
The strongest fit is a restaurant that wants to sell online without commission drag, protect its own customer data, and scale across locations without adding complexity. If the growth question is really about how to capture more of the demand already out there, direct online ordering becomes the practical next step, because restaurants keep 100% of every sale.
Ready to take back your online ordering? Book a Demo

Sruthi Sekar specializes in brand strategy, growth, and user experience in the hospitality industry. As the driving force behind Restolabs, she helps restaurants harness technology to scale and thrive. With a background in design, branding, and entrepreneurship, she brings a sharp focus on crafting digital experiences that drive real business impact.
Frequently Asked Questions
Yes. Sales are still rising in 2026, but nominal revenue growth is stronger than real demand growth because prices are part of the increase.
The useful split is about 4.8% nominal growth versus 1.3% real growth, which means pricing is doing more of the work than traffic.
Limited-service, quick-service, delivery-native, pickup-heavy, and convenience-led formats are showing the strongest momentum, while full-service growth is more mixed.
In many categories, yes, but not everywhere. Grocery and convenience is delivery-native, while cafe and coffee still skews heavily toward pickup and dine-in.
Very important. Our data shows about 80% of orders come from returning customers, so reordering speed is a major growth lever.
They show that owned ordering is still expanding at scale, with 4,000,000+ orders, $34.1M GOV, and 2,126 active locations across 479 brands from March 2025 to March 2026\.






.webp)

.svg)
.webp)