
Key Takeaways
- Direct online ordering is less about raw traffic than it is about timing, repeat purchase speed, and fulfillment mix.
- Pickup plus dine-in still outweighs delivery in our data, which matters for restaurants trying to protect margin and staffing.
- Cuisine-level basket size varies sharply, so one generic order-value target is not useful for operators.
- Most ordering is driven by returning customers, and the first 10 days after a purchase matter more than many operators expect.
What this food industry report covers for restaurants
Most broad food industry coverage stays at the level of market size or category growth. That framing works for a boardroom slide, but it does not tell you when to schedule prep, which day needs the strongest win-back push, or whether delivery is even the larger share of your online demand.
This report is more operational. Our data from the Restolabs 2026 Online Ordering Behaviour Report covers March 2025 to March 2026, spanning 4,000,000+ orders across 2,126 active locations and 479 brands. That scale surfaces real patterns in timing, repeat behavior, fulfillment mix, and cuisine-level basket differences. If you are working to own your direct ordering channel, those are the numbers that actually move a decision.
For broader context, Mordor Intelligence estimates that restaurant-to-consumer direct channels held 68.75% of the online food delivery market in 2025. The majority of demand is already flowing through first-party channels. The question is whether you are set up to capture and keep it.
When do customers order online most?
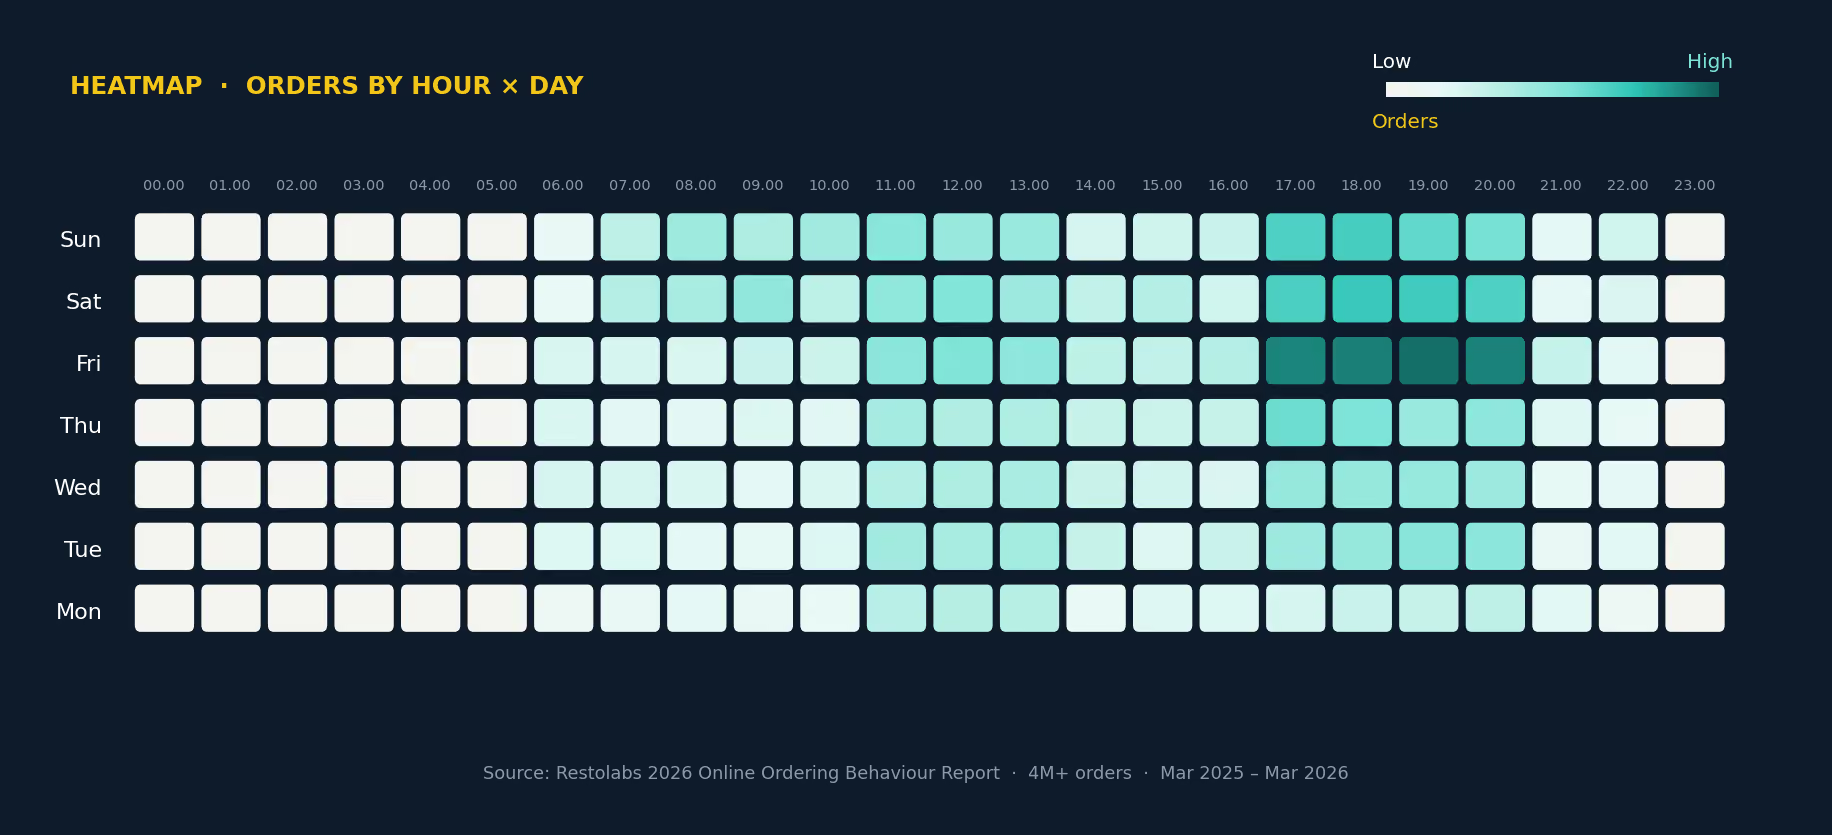
Friday is the busiest ordering day, dinner from 5:30 to 8:30 PM is the main peak, and Monday is the softest day for demand across the year.
That pattern turns a vague sense of a busy week into a concrete schedule. If Friday and dinner are your strongest windows, staffing, prep, promo timing, and inventory should follow that rhythm rather than a flat weekly average that hides both peaks and slow stretches.
There are secondary patterns worth building around. Weekend mornings from 7 to 10 AM and lunch from 11 AM to 1 PM both show meaningful volume in our data. Direct online ordering is not only a dinner story. For cafes, bakeries, and breakfast-led concepts, the daypart shape looks very different from a pizza or burger business, so the average restaurant week is not your week.
How fast do repeat orders happen?
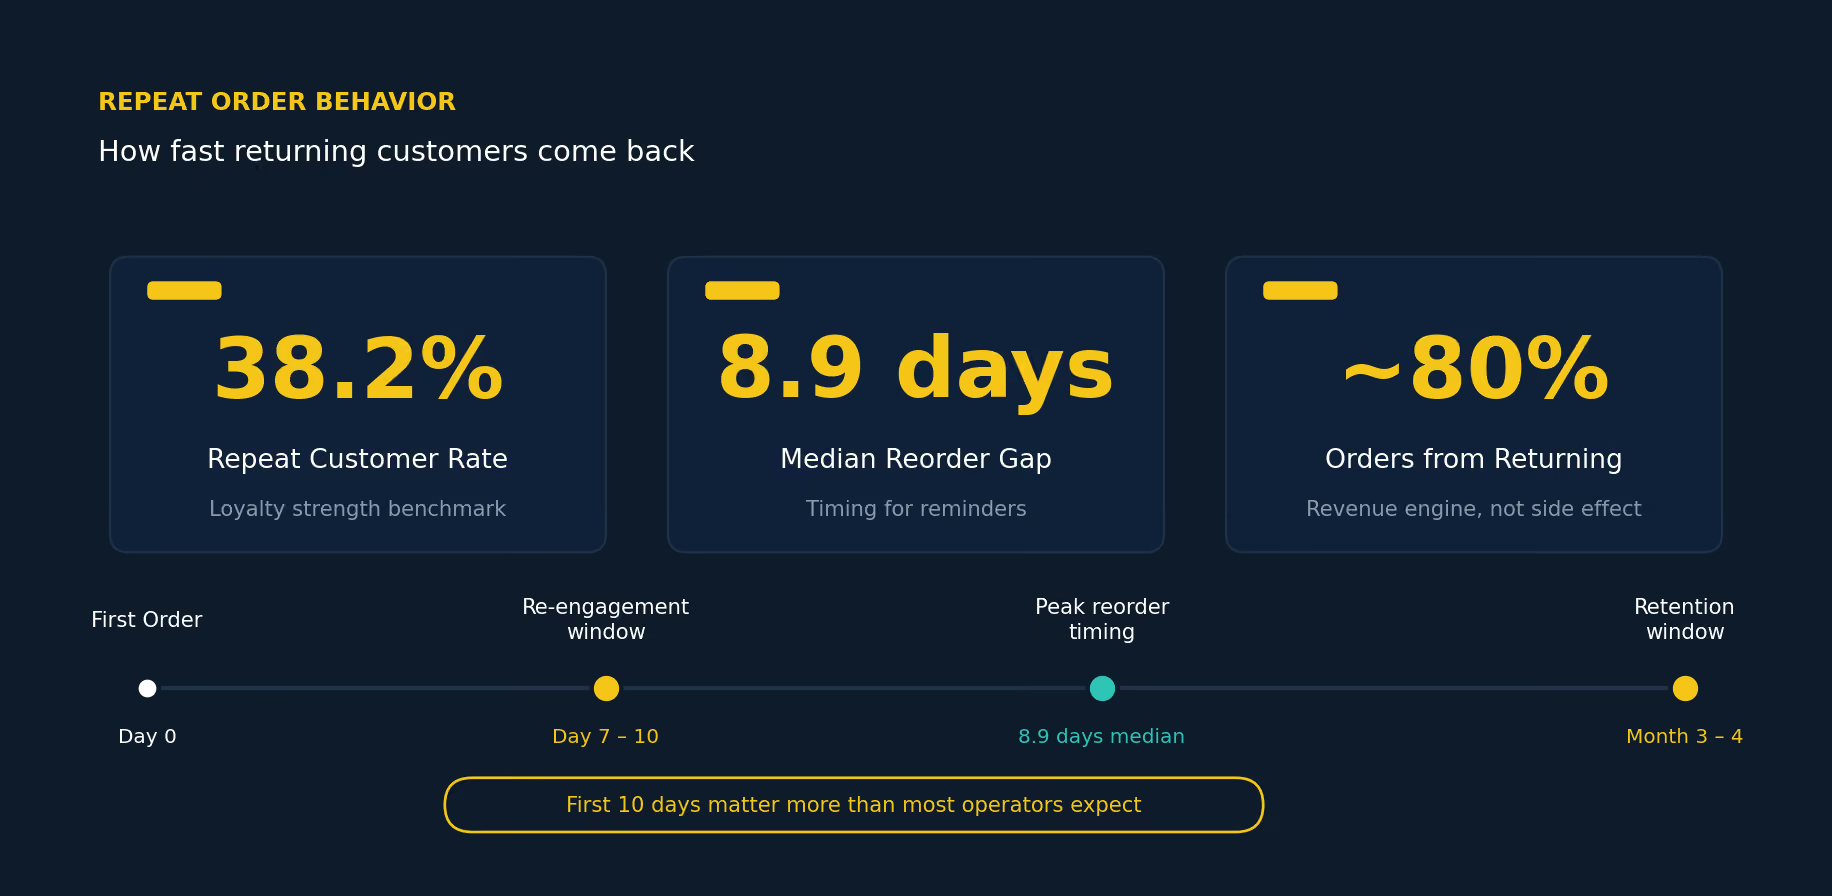
Repeat ordering happens faster than many restaurants expect. Our data shows an 8.9-day median gap between orders and a clear re-engagement window on days 7 to 10.
That timing is the real story behind direct ordering growth. You can spend heavily to win a first-time guest, but if they do not return inside the first 10 days, the next order gets harder to earn. Roughly 80% of orders in our data come from returning customers, which means loyalty is not a pleasant side effect. It is the engine that keeps the channel running.
The same logic extends to a longer horizon. Month 3 to 4 is the key retention window, so restaurants that only focus on the first order are leaving revenue on the table. The smarter move is matching the reorder cycle a guest is already showing you, then nudging at the moment they are most likely to buy again rather than blasting the same message to every guest on the same day.
If you want a practical starting point, the guide on how to drive more direct online orders walks through reminder timing that fits this window.
Is pickup or delivery leading restaurant fulfillment?
Pickup plus dine-in leads at 60.1%, while delivery accounts for 39.9%, so first-party ordering deserves at least as much attention as delivery economics.
A lot of industry commentary leans hard into delivery, and it is easy to assume that is where all the online action lives. The order mix in our data says otherwise. For concepts with strong dine-in or local pickup demand, the pickup experience is not a side channel to bolt on later. It is the main event, and the checkout flow should be built around it.
Fee behavior reinforces the point. About 77% of fee orders carry a $0 fee, the average applied fee is $2.26, and the $1 to $5 band covers only about 12% of orders. That means you can shape direct ordering economics far more deliberately than the narrative that delivery eats all your margin. This is especially true if the goal is a simple checkout that still protects the bottom line.
Which cuisine types drive the highest order value?
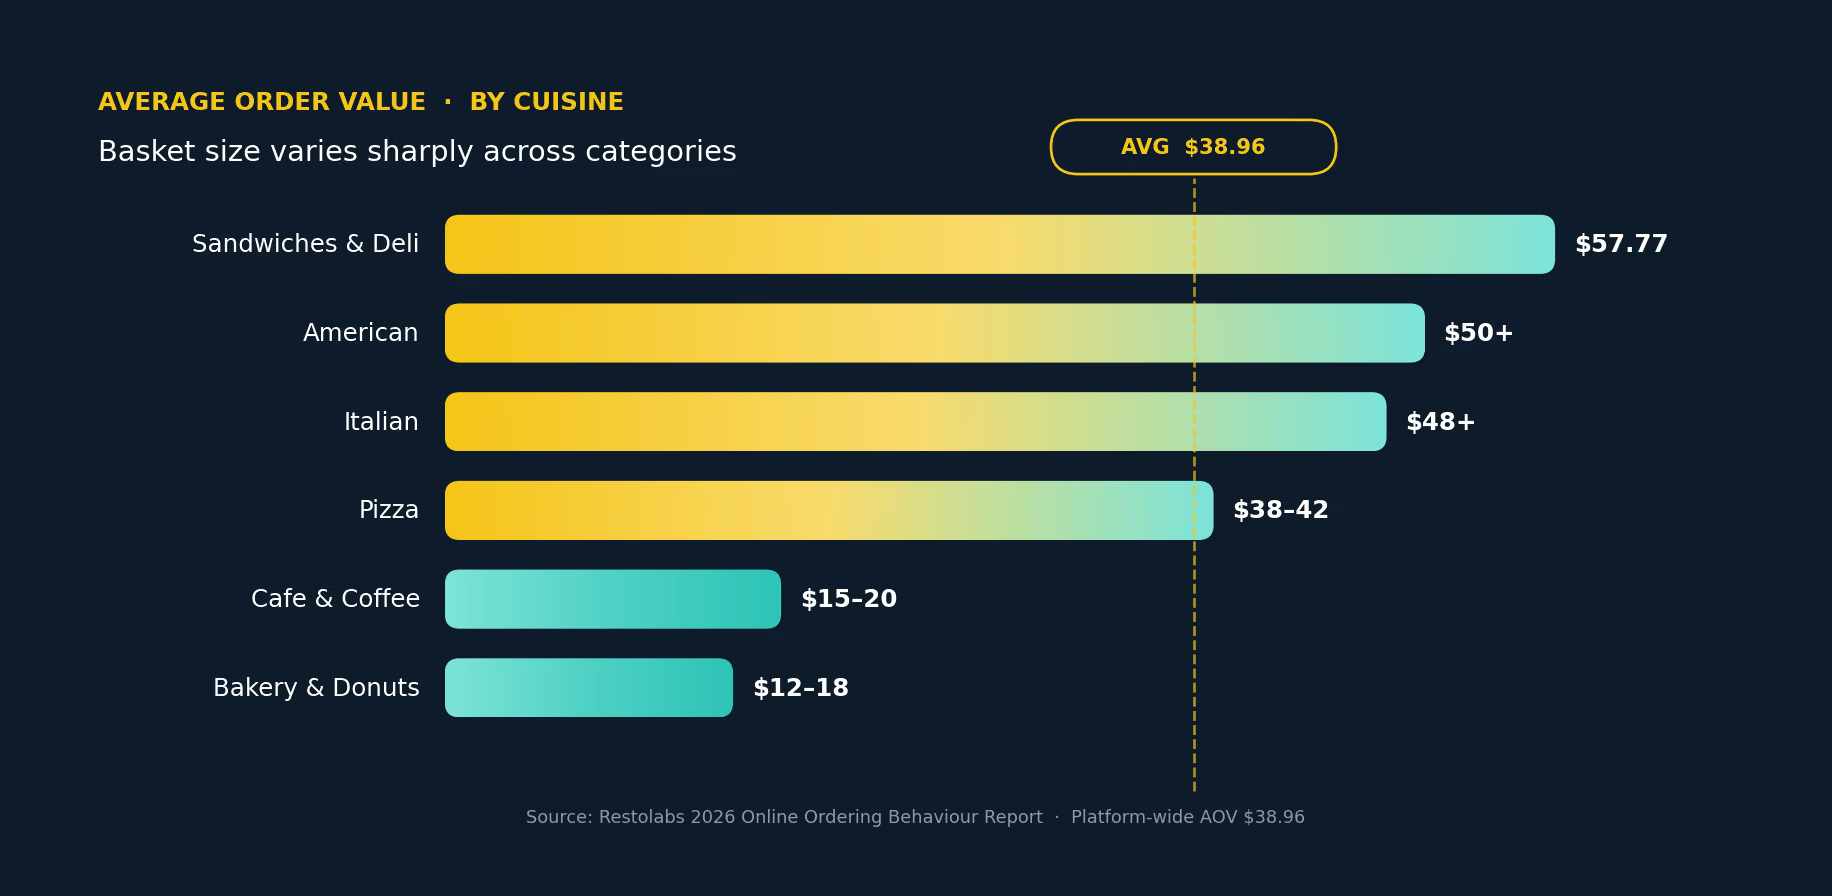
Sandwiches and Deli leads with the highest average order value at $57.77, followed by American and Italian, while Cafe and Coffee and Bakery and Donuts sit considerably lower.
A single platform-wide average does not help a bakery the way it helps a family-style Italian spot. Category context changes almost everything downstream, from menu architecture to upsell strategy to how you think about delivery economics. Most industry reports publish one number. The spread by cuisine is where decisions actually get made.
The range is wide enough to matter. Pizza sits in the $38 to $42 range, close to the platform-wide $38.96 AOV, while Cafe and Coffee lands around $15 to $20 and Bakery and Donuts around $12 to $18. If your concept lives in one of the lower-basket categories, chasing a higher industry average is the wrong target. The better play is a menu and checkout flow that supports attachment, frequency, and smaller but far more repeatable orders. Cafes and bakeries win on repeat visits, not on one large ticket.
For a deeper look at structuring a menu that nudges basket size, the breakdown of restaurant menu examples is a useful reference.
Where is direct online ordering strongest?
The strongest direct ordering behavior in this dataset appears across the United States, Europe, the United Kingdom, Singapore, and the UAE.
That geographic spread is a reminder that direct online ordering is not confined to one market or one buying culture. Multi-location operators will see different ordering rhythms by region, but the core questions stay constant: where do guests order directly, how often do they return, and which fulfillment model wins locally?
This matters most for brands expanding across borders. A market with strong pickup behavior does not need the same channel mix as one that leans harder into delivery. Reading the local reorder gap and pickup share before committing to staffing levels and delivery contracts saves a lot of expensive guessing. The order data should shape the operating model in each region, not the other way around.
Our Data: United States, Europe, United Kingdom, Singapore, and UAE are the most relevant markets in our direct ordering dataset - Restolabs 2026 Online Ordering Behaviour Report
How Restolabs helps restaurants own direct ordering
The value of everything above only shows up when a restaurant can act on it: owning the customer relationship, reducing checkout friction, and using its own order data to make decisions.
Restolabs is built for that kind of control. The platform gives operators a commission-free online ordering setup with full ownership of customer data, so timing, retention, pickup demand, and cuisine-level basket behavior become levers operators can pull rather than trends they read about. If you want the full March 2025 to March 2026 breakdown, the complete online ordering report is available.
Ready to take back your online ordering? Book a Demo

Sruthi Sekar specializes in brand strategy, growth, and user experience in the hospitality industry. As the driving force behind Restolabs, she helps restaurants harness technology to scale and thrive. With a background in design, branding, and entrepreneurship, she brings a sharp focus on crafting digital experiences that drive real business impact.
Frequently Asked Questions
It is a market and behavior summary that helps restaurant operators understand demand patterns, ordering timing, retention, and fulfillment mix so they can make better staffing, menu, and channel decisions.
Friday is the strongest day, and dinner from 5:30 to 8:30 PM is the main ordering window, while Monday is the softest day for demand.
Our data shows an 8.9-day median gap between repeat orders, with day 7 to 10 as the strongest re-engagement window.
Yes. Pickup plus dine-in makes up 60.1% of orders in our dataset, compared with 39.9% delivery.
Sandwiches and Deli has the highest AOV at $57.77, followed by American at $50+ and Italian at $48+.
It measures direct online ordering behavior across 4,000,000+ orders, including timing, retention, fulfillment mix, cuisine order value, and geographic patterns.
The United States, Europe, the United Kingdom, Singapore, and the UAE stand out in the dataset.





.webp)

.svg)
.webp)