
.avif)
Key Takeaways
- Delivery matters, but it does not replace pickup or dine-in. Our data shows a 39.9% delivery share, which means mixed fulfillment is the real operating model.
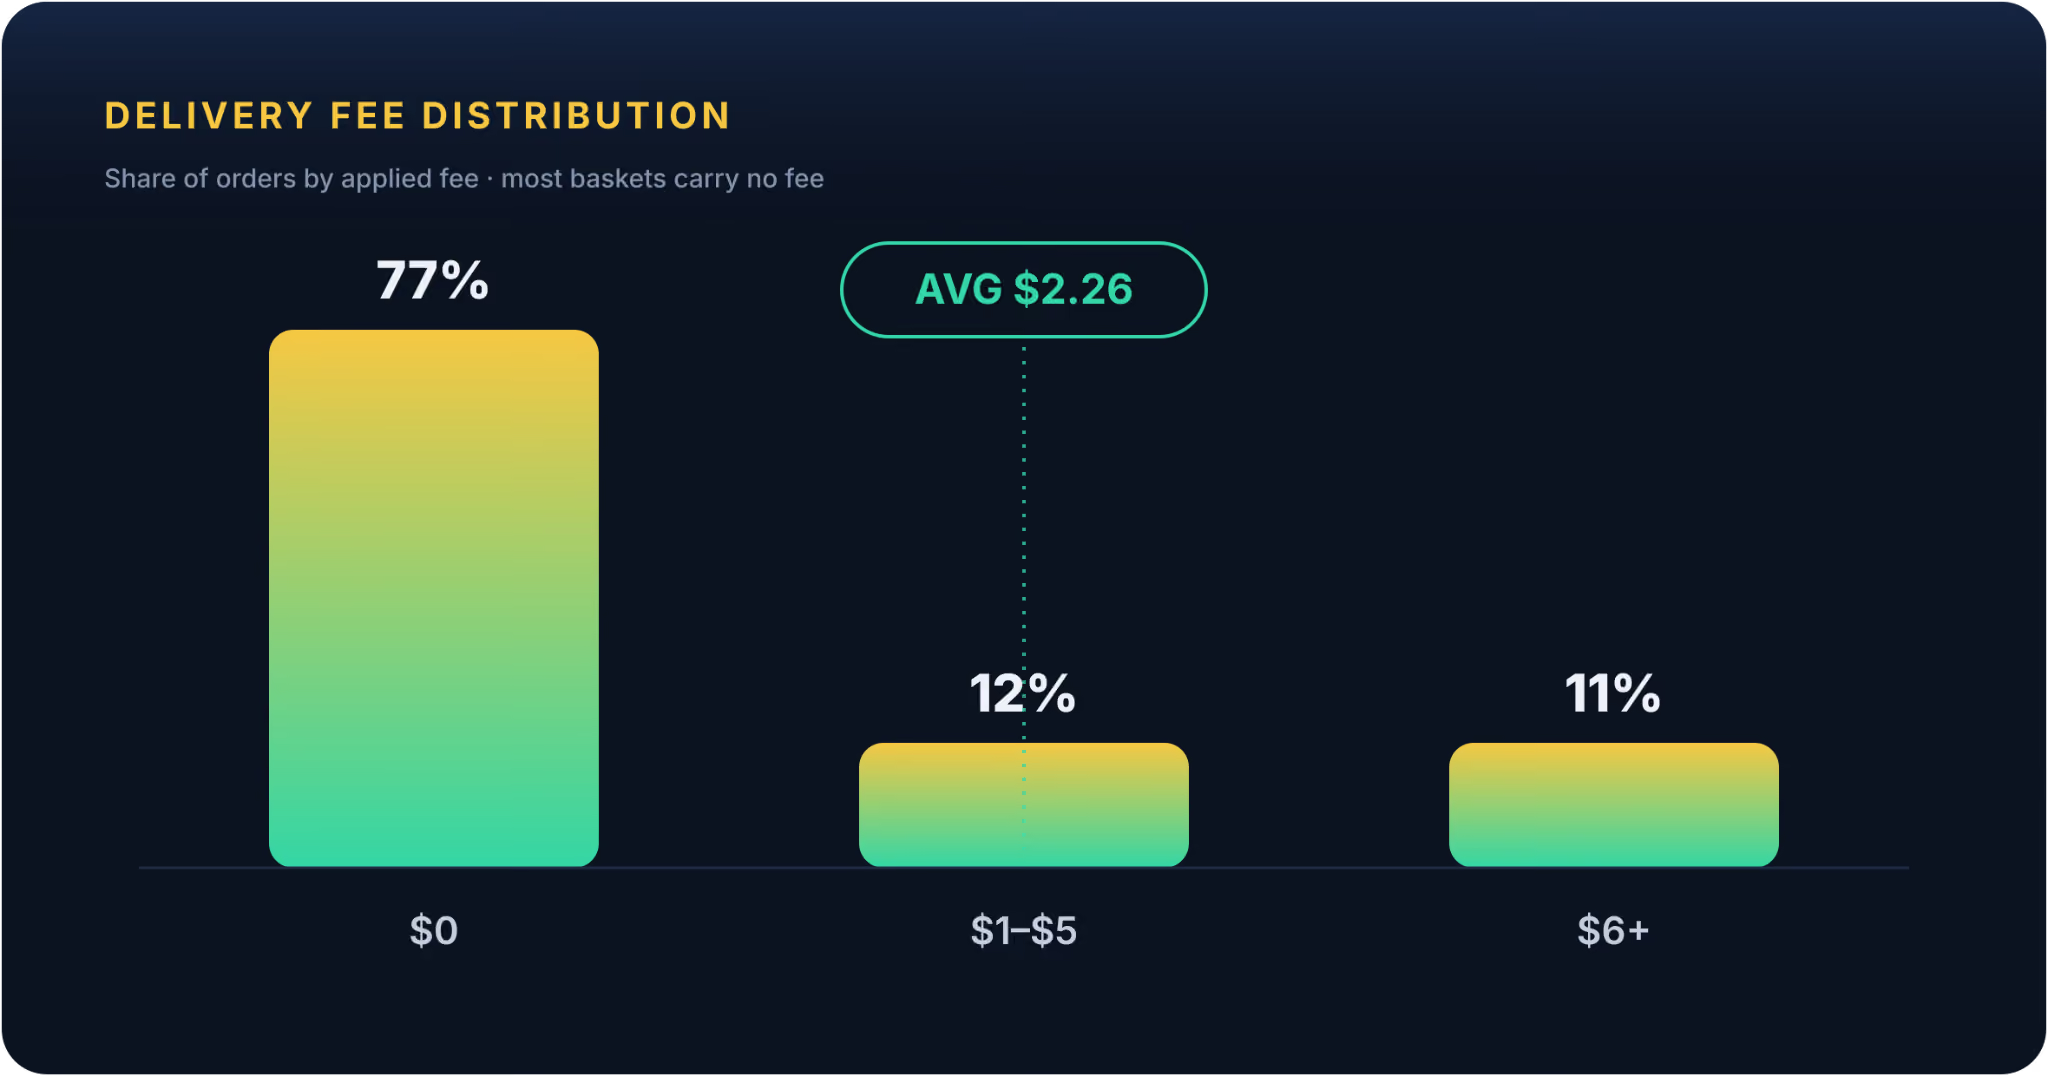
- Small fee changes can move conversion. Most orders sit at $0, the $1 to $5 band is still meaningful, and the average applied fee is only $2.26.
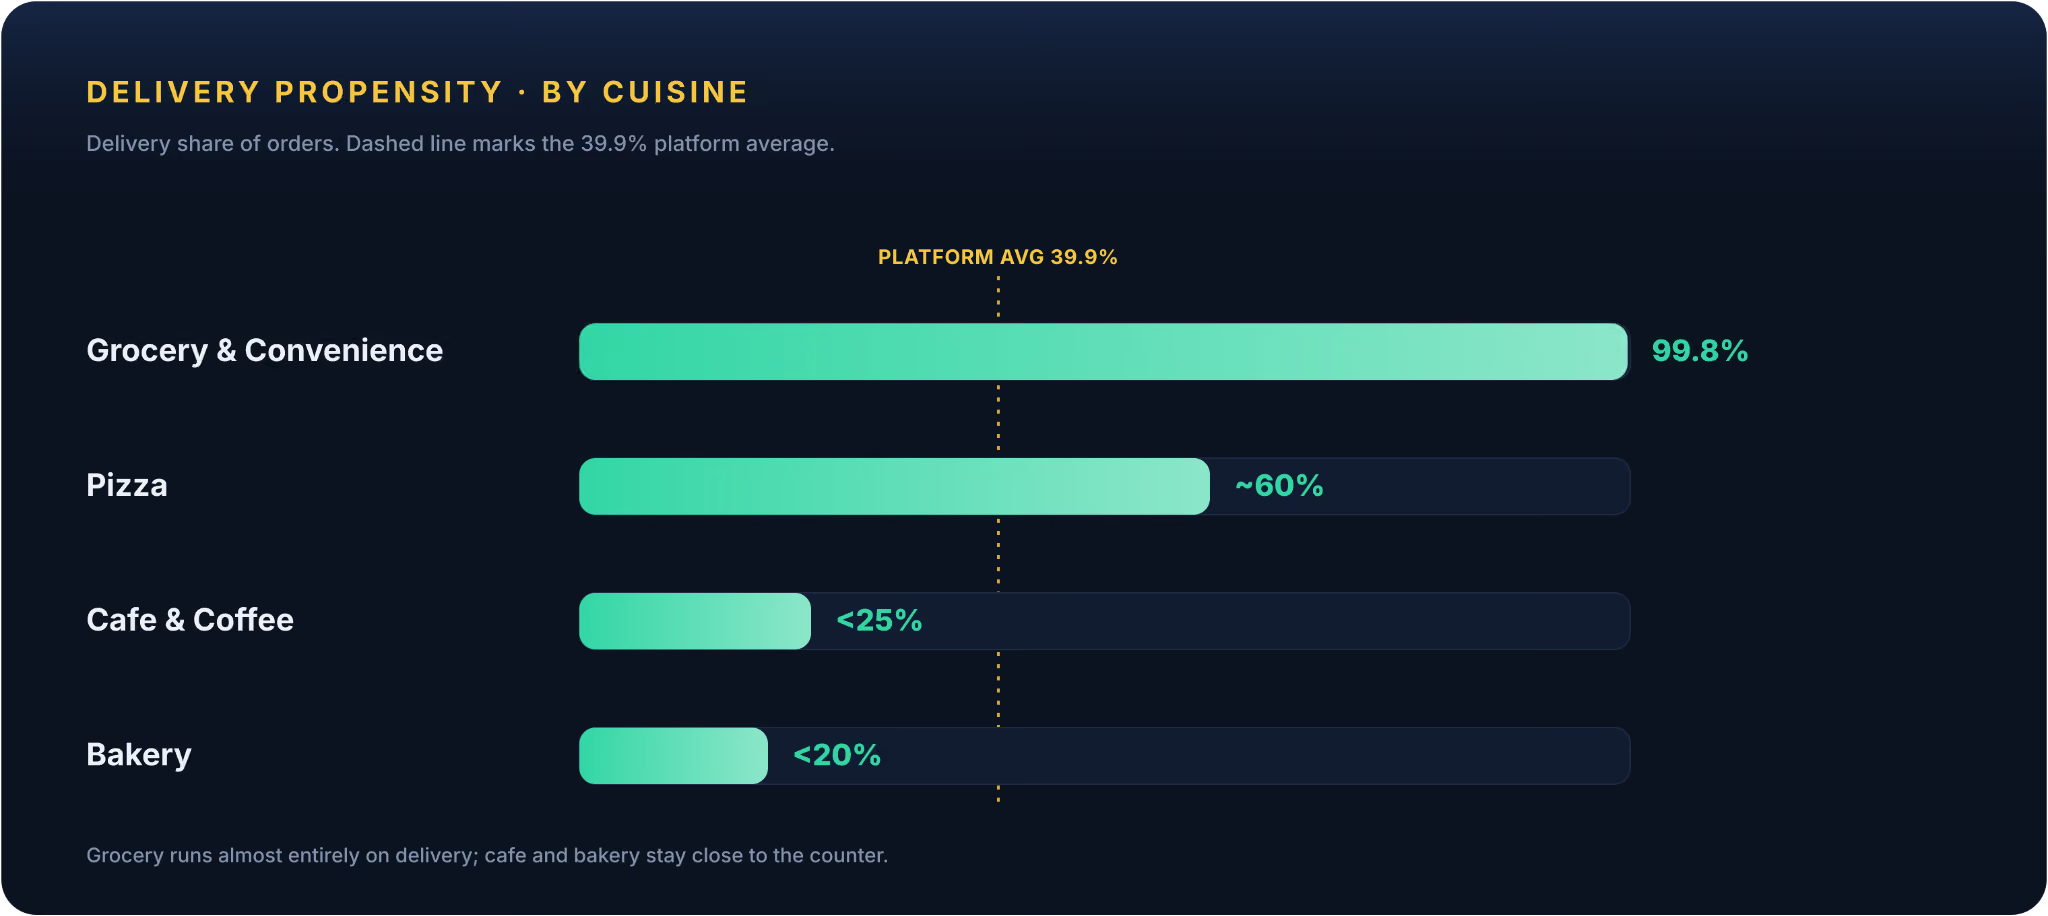
- Cuisine changes the channel mix more than many operators expect. Grocery runs almost entirely on delivery, while cafe and bakery traffic still leans heavily toward pickup and dine-in.
- Timing and repeat behavior are where the margin lives. Friday and dinner are strongest, Monday lags, and the median reorder gap is 8.9 days.
How much of restaurant demand actually goes to delivery?
Roughly four in ten orders are delivery, and the rest go to pickup and dine-in. That single split drives almost every decision upstream of the kitchen, from checkout design to prep timing to how you schedule staff.
According to our data from the Restolabs 2026 Online Ordering Behaviour Report, 39.9% of orders were delivery and 60.1% were pickup plus dine-in. Think about how the choice actually plays out from a customer's perspective. Someone two blocks away often skips the fee and walks in for pickup, while someone across town wants the food brought to them. Both are ready to buy. The problem starts when the checkout flow, the prep timing, and the menu layout only make sense for one of them.
Most consumer-focused resources treat delivery as if it were the entire category. For an operator, that framing hides the real work. Market.us Scoop reports that 60% of U.S. customers ordered online food at least twice a week in 2026, and roughly 40% of diners say they prefer ordering through a restaurant's own website or app. Put those together and the message is clear: diners want easy ordering, not just a marketplace app.
Delivery strategy works best when pickup and dine-in are treated as first-class paths, not afterthoughts stacked behind a delivery button. If the majority of your orders never get in a car, the checkout experience should reflect that.
What do delivery fees look like in practice?
Fee sensitivity is real, but it clusters at the low end. Most orders carry no fee at all, a meaningful slice sits between $1 and $5, and the average applied fee across the platform is just over two dollars.
Our data shows an average applied fee of $2.26, with about 77% of orders at $0 and roughly 12% in the $1 to $5 range.
Operators often treat delivery fees as a fixed cost line. In practice they behave more like a conversion lever. When the fee feels heavy against a small basket, the customer does the math in their head and either switches to pickup or closes the tab entirely. A $3 fee on a $12 order reads very differently than the same fee on a $45 order.
The broader market context makes fee discipline more important, not less. A 2025 to 2026 report from MarketDataForecast puts the U.S. online food delivery market at $119.46B in 2025 and $130.28B in 2026. More spend is flowing through a channel where small checkout details decide whether an order lands.
Tie fee tolerance to basket size and the availability of a pickup option, not to a flat revenue target. If your average delivery basket is small, a fee that feels fair on larger tickets may quietly be pushing orders toward pickup or nowhere at all.
Which cuisines are most likely to be delivered?
Cuisine mix shifts fulfillment behavior more than broad market summaries suggest. Grocery and convenience runs almost entirely on delivery, cafe and bakery lean heavily toward pickup, and pizza sits somewhere in the middle.
Our data shows Grocery and Convenience at 99.8% delivery, Cafe and Coffee above 75% pickup and dine-in, Bakery above 80% pickup and dine-in, and Pizza carrying a pickup share of around 40%.
That spread is the reason a single fulfillment playbook rarely fits across a whole brand. Each category behaves like its own operation. A grocery order lives and dies on speed and accuracy. A bakery order usually starts with a morning pickup mindset, which is why pre-order timing matters more than a delivery-first layout. Cafe traffic is built around proximity and convenience. Pizza stretches across dinner and late night, but even there a large chunk of demand still walks up to the counter.
Most articles on this topic open with platform market-share charts. For an operator, that answers the wrong question first. The one that actually changes daily operations is this: which menu categories convert into delivery, and which ones stay close to the counter regardless of what the app offers? Statista provides useful market context, but the packing station and the prep line respond to food type, not platform size.
Packaging, prep timing, and menu structure should vary by cuisine rather than being copied across the brand. A pizzeria and a cafe are not solving the same fulfillment problem, even when they run on the same platform.
When do food delivery orders peak?
Demand is concentrated, not spread evenly across the week. Friday is the strongest ordering day, Thursday and Saturday follow close behind, Monday is the weakest, and the dinner window carries the bulk of daily volume.
Our data shows Friday as the highest ordering day, Monday as the lowest, dinner from 5:30 to 8:30 PM as the main peak, and late-night orders from 9 to 11 PM tilting heavily toward pizza delivery. When the busiest window is that predictable, labor, prep, and promotional timing should bunch around it rather than spread evenly across every hour.
The common mistake is treating every shift the same. Staff the same way, prep the same batch every morning, and the busy hours feel strained while slower ones still burn payroll. The better move is to read the pattern and build toward the spike before it arrives. Aligning prep with demand concentration gives a cleaner service flow and protects throughput during the periods that actually matter.
Monday's slow traffic is not a loss. It is the right day to run a win-back offer or test a workflow change without gambling on your busiest shift.
How important is repeat ordering to delivery revenue?
Repeat orders carry most of the weight. A large share of customers come back within days, and returning diners account for the overwhelming majority of volume, which makes delivery revenue a timing story as much as an acquisition one.
Our data shows a 38.2% repeat customer rate over a six-month lookback, a median of 8.9 days between repeat orders, and returning customers driving about 80% of total orders. If the median reorder gap is under nine days, waiting a month to re-engage is far too late for a significant portion of your customer base.
That number reframes the whole retention question. The window for a useful reminder or reorder nudge opens fast. Our data points to day 7 to 10 as the natural sweet spot for pulling someone back before the habit fades. Miss that window and you are trying to rebuild a routine instead of extending one.
This is where owning the order flow pays off. Marketplace traffic can push volume, but retention gets harder when the customer relationship is fragmented across apps you do not control. A restaurant that owns the ordering journey can time the next offer around recent behavior rather than a generic promotional calendar. Restolabs' own online ordering statistics and retention playbook point to the same conclusion.
When 80% of orders already come from returning customers, the cheapest growth is usually the reorder you almost missed, not the new customer you paid to acquire.
How does this differ from consumer "which app" searches?
Consumer searches ask which delivery app is biggest or best. Operators need to know what to do with demand once it arrives, which points to fulfillment mix, fee tolerance, cuisine behavior, and reorder timing.
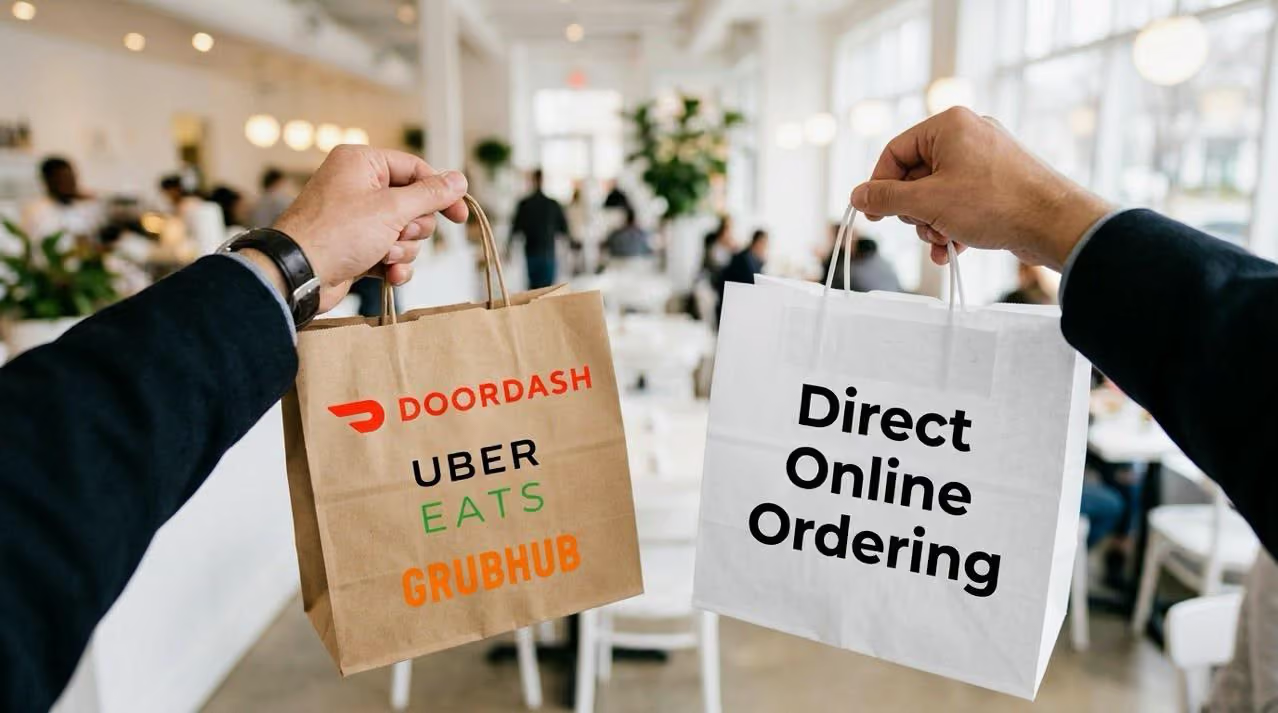
A consumer-facing page will often lead with the major marketplace names and rank them by market share. That is fine reading for a diner deciding where to tap tonight. It does very little for an owner deciding how to staff Friday dinner or where to set a delivery fee. Those platform names belong in the conversation as market context, but the useful part starts after checkout: how does the order actually behave, and what does the operation need to do about it?
It also helps to remember that delivery is one channel inside a broader online ordering system, not the system itself. For a restaurant that wants control over customer data and order flow, the trending app is beside the point. The real question is whether the operation can handle pickup, delivery, and repeat orders cleanly without handing the customer relationship to someone else. Stop ranking apps in your head and start reading your own order data. The numbers on fees, cuisine, timing, and repeat behavior are the ones that actually move a P&L.
How does Restolabs help restaurants own online ordering?
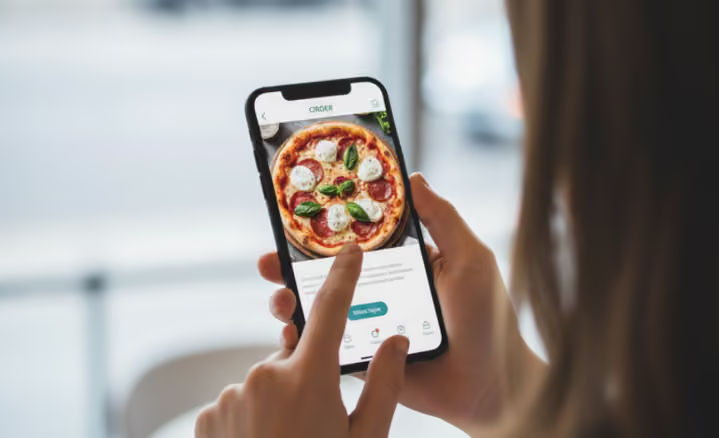
Restaurants that want more direct demand need a system that runs pickup and delivery in one place, keeps customer data in house, and strips friction out of checkout. Restolabs is built for operators who want that control without the commission-heavy tradeoff.
The platform fits the pattern in the data. When delivery is meaningful but not dominant, the strongest setup is the one that handles every order type cleanly, supports repeat business through timely re-engagement, and keeps the restaurant in control of the customer relationship. That is the difference between renting your customers from a marketplace and owning them outright.
Ready to take back your online ordering? Book a Demo

Sruthi Sekar specializes in brand strategy, growth, and user experience in the hospitality industry. As the driving force behind Restolabs, she helps restaurants harness technology to scale and thrive. With a background in design, branding, and entrepreneurship, she brings a sharp focus on crafting digital experiences that drive real business impact.
Frequently Asked Questions
About 39.9% in our data, with 60.1% going to pickup plus dine-in.
Our average applied fee is $2.26, with most orders at $0 and a smaller share in the $1 to $5 range.
Grocery and Convenience is nearly all delivery at 99.8%, while Cafe and Coffee and Bakery skew heavily toward pickup and dine-in.
Friday is the strongest day, dinner from 5:30 to 8:30 PM is the biggest window, and late-night pizza drives delivery from 9 to 11 PM.
Our median repeat gap is 8.9 days, and returning customers account for about 80% of orders.
Use them to shape fees, staffing, menu structure, and re-engagement timing, rather than treating delivery as a standalone channel separate from the rest of operations.
Our data shows that repeat orders, fee sensitivity, and mixed fulfillment all matter in practice, which is why owning the order flow gives operators a structural advantage over relying on marketplace apps alone.






.webp)

.svg)
.webp)