
.avif)
Key Takeaways
- Read 2026 direct ordering trends as an operations guide, not just a growth story. The value is in knowing when demand spikes, how stable fulfillment is, and who keeps coming back.
- Order volume follows a repeatable cycle. Q1 and Q3 run strongest, with a softer mid-year and summer stretch you can plan around.
- Pickup still carries the larger share of direct orders, so building for delivery alone misses the real pattern.
- Follow-up timing beats broad awareness. There is a short window after a first order when the next one is most likely.
- Our Data: 4,000,000+ orders across 2,126 active locations and 479 brands show that returning customers, not one-time traffic, drive most direct order volume. - Restolabs 2026 Online Ordering Behaviour Report
Most coverage of online ordering trends treats the story as one long climb in digital demand. That framing is not wrong, but it is not very useful once you are running a kitchen. The more practical question is where that demand lands, when it softens, and which customers keep it moving.
This piece looks at direct ordering behavior from real order data, not marketplace projections. The pattern that emerges is steadier and more plannable than most trend pieces suggest.
What do direct online ordering trends mean in 2026?
In 2026, the most useful online ordering trends are operational: seasonality, fulfillment mix, repeat behavior, and the windows when ordering pressure peaks.
Retail trend pieces tend to talk about digital ordering as if it were a single rising line. For a restaurant, that framing hides the part that actually shapes your week. Demand behaves differently across the year, across pickup and delivery, and across new versus returning guests. Each of those shifts changes how you staff, plan the menu, and time your retention work.
The question is no longer whether digital ordering matters. It is where that demand concentrates, when it dips, and what kind of customer keeps returning. Those answers turn a vague trend into a staffing decision.
That is why the numbers below matter. They are not projections about the industry at large. They come from direct orders placed on restaurant-owned channels, which is exactly the environment most operators are trying to grow.
According to our data from the Restolabs 2026 Online Ordering Behaviour Report, first-party ordering has moved from an experiment to a core channel. That aligns with wider industry sentiment. A 2025 online ordering report found that 40% of quick service and fast casual operators expect first-party ordering to be their top growth channel, ahead of drive-thrus and third-party delivery. The trend is real. What follows is how it behaves on the ground.
How does order volume change through the year?
Order volume is strongest in Q1 and Q3, while the middle of the year softens, so the smart move is to plan labor and promotions around that cycle instead of reacting month to month.
Think of the calendar in two strong windows. January through March opens the year with real demand, and July through September rebuilds it. The soft patch sits in the middle, roughly late spring into summer, where many teams feel demand flatten but keep staffing and campaigns on autopilot for a few weeks too long.
The important part is that this is not random noise. Our data shows a repeatable shape, which means you can calibrate ahead of it. Tighten labor and lean into promo timing when the strong quarters arrive. Ease inventory and adjust campaign spend when the mid-year dip lands, then rebuild momentum going into Q3.
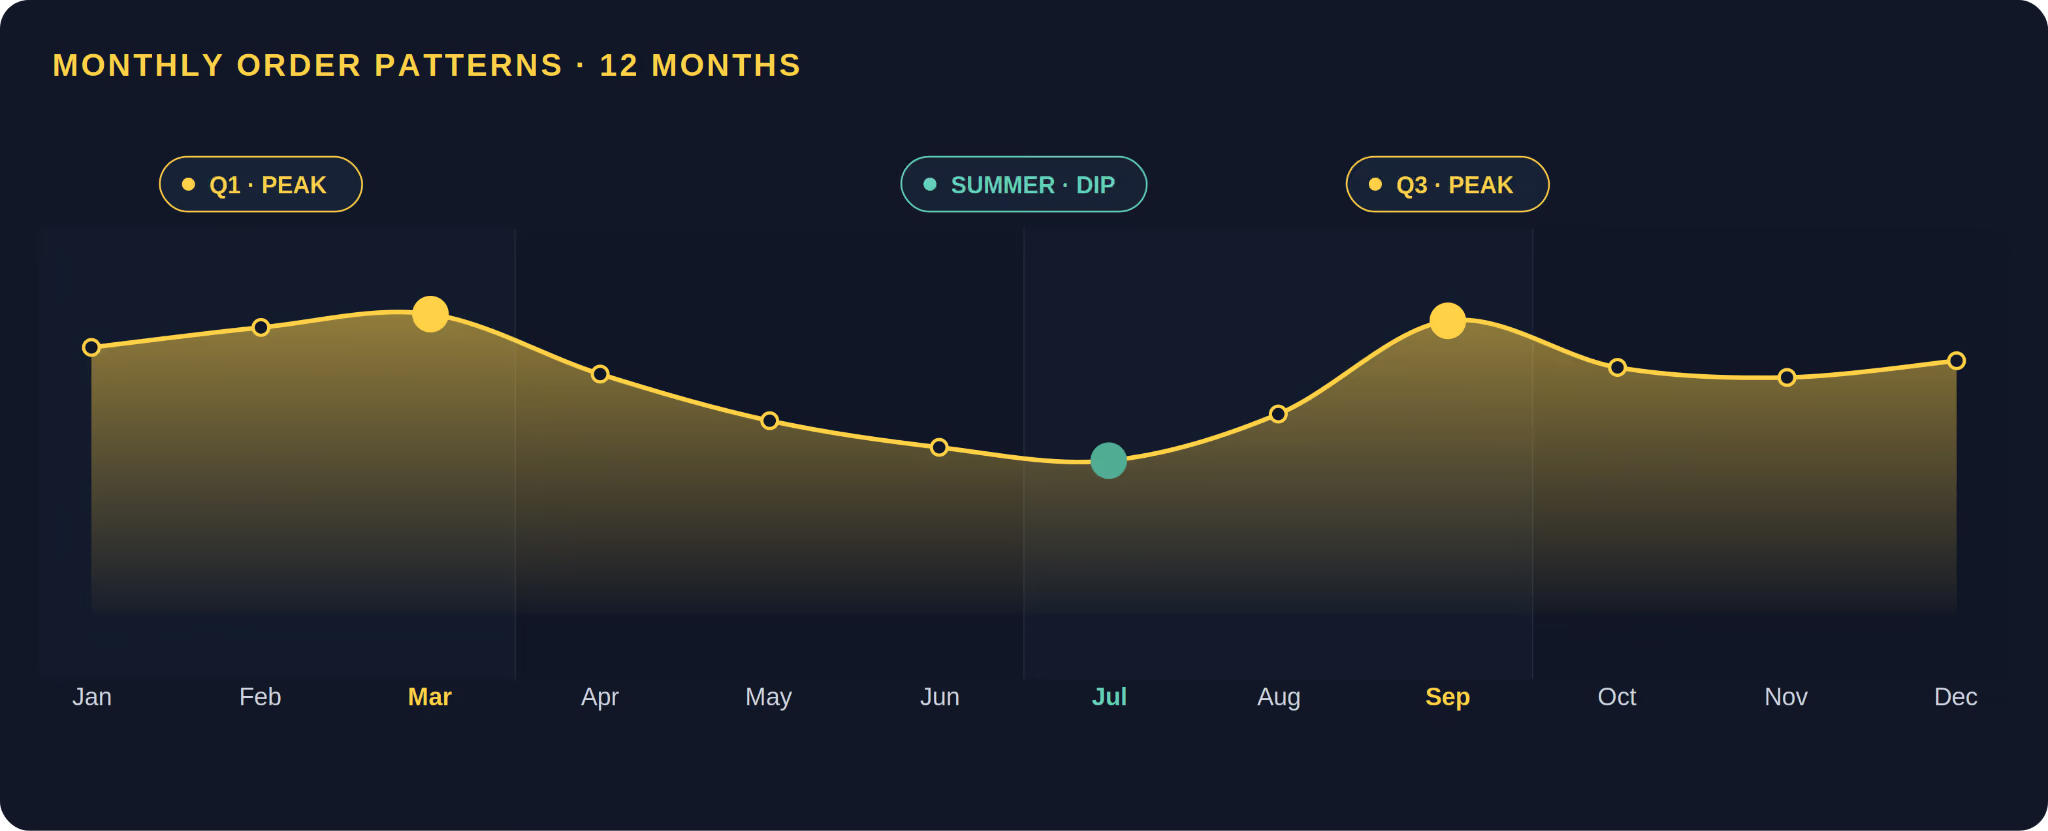
Most trend articles present seasonality as a wildcard you simply endure. The order data says the opposite. When the peaks and the dip land in the same stretches year over year, they stop being surprises and start being line items you schedule against. That is the difference between reacting to a slow July and pricing your labor for it in June.
If you want a structured way to run against these patterns, a restaurant marketing calendar is a practical place to line up promos with the strong quarters.
Why is pickup still more stable than delivery?
The order mix holds close to 60.1% pickup and dine-in versus 39.9% delivery, and that split stays steady through the year, so both fulfillment paths deserve real attention.
There is a common assumption that delivery is quietly replacing pickup. Our data does not support it. Direct online ordering splits in a way that stays remarkably stable across the calendar, which means the smart move is to support both flows well rather than overbuild one and let the other drift.
The obvious point is that delivery matters. Everyone already knows that. The more useful point is that pickup still carries the larger share of direct orders, so the guest experience has to stay frictionless from checkout through handoff. When the pickup flow is clunky, the bigger half of the channel is the half that suffers.
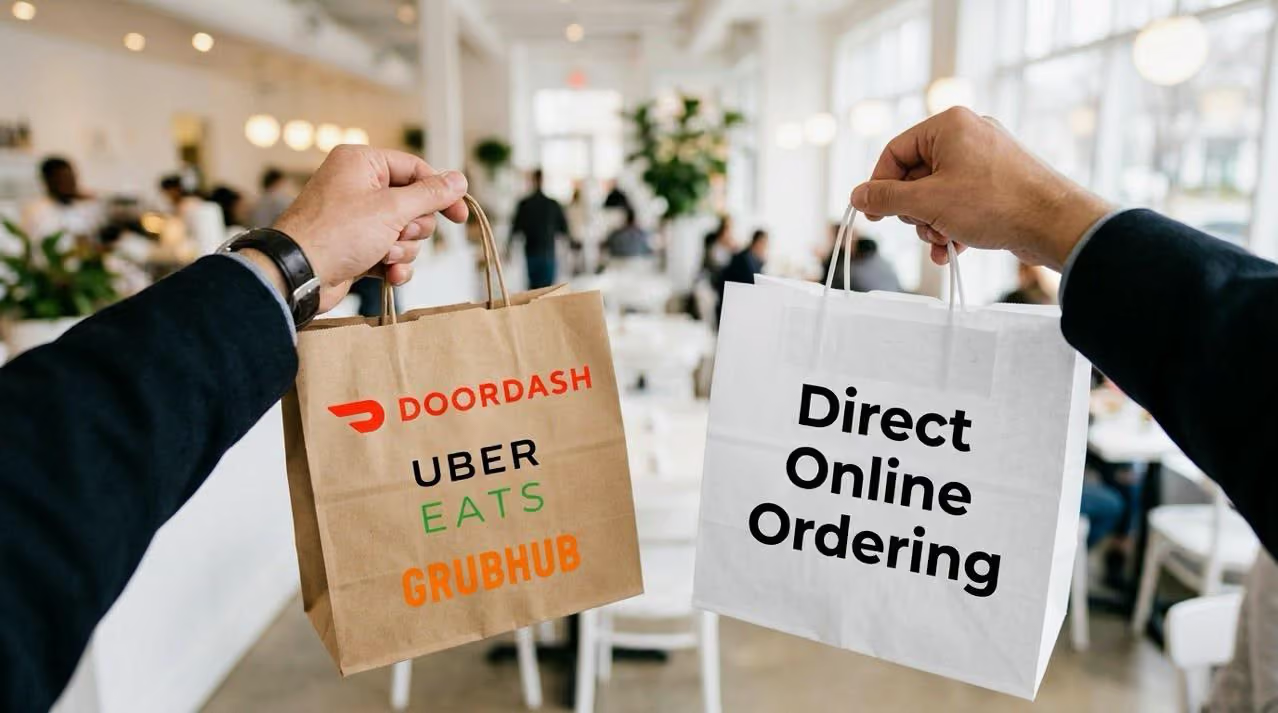
For context, a 2025 National Restaurant Association figure reported that 82% of adult diners plan to order delivery in 2025. Delivery demand is clearly strong. Even so, our data makes the restaurant reality plain: delivery is powerful, but pickup is still the anchor. That is worth remembering the next time you weigh where to invest in ordering flow improvements. If you are still deciding how much to lean into owned channels versus marketplaces, this comparison of third-party delivery and direct ordering covers the tradeoffs.
How dominant are returning customers in online ordering?
Returning guests drive about 80% of orders, so retention work and fast follow-up matter far more than chasing one-time traffic.
Direct ordering is not really an order-collection game. It is a habit loop. Once a customer orders directly, the next order often comes fast, which makes what you do after the purchase more valuable than broad awareness on its own. A guest who already knows your brand is the guest most likely to place your next order.
This is why the reorder window is one of the most actionable numbers in the whole picture. It tells you roughly when the next nudge is most likely to land. That is far more concrete than generic loyalty advice, because it points to a real gap between the first order and the repeat.
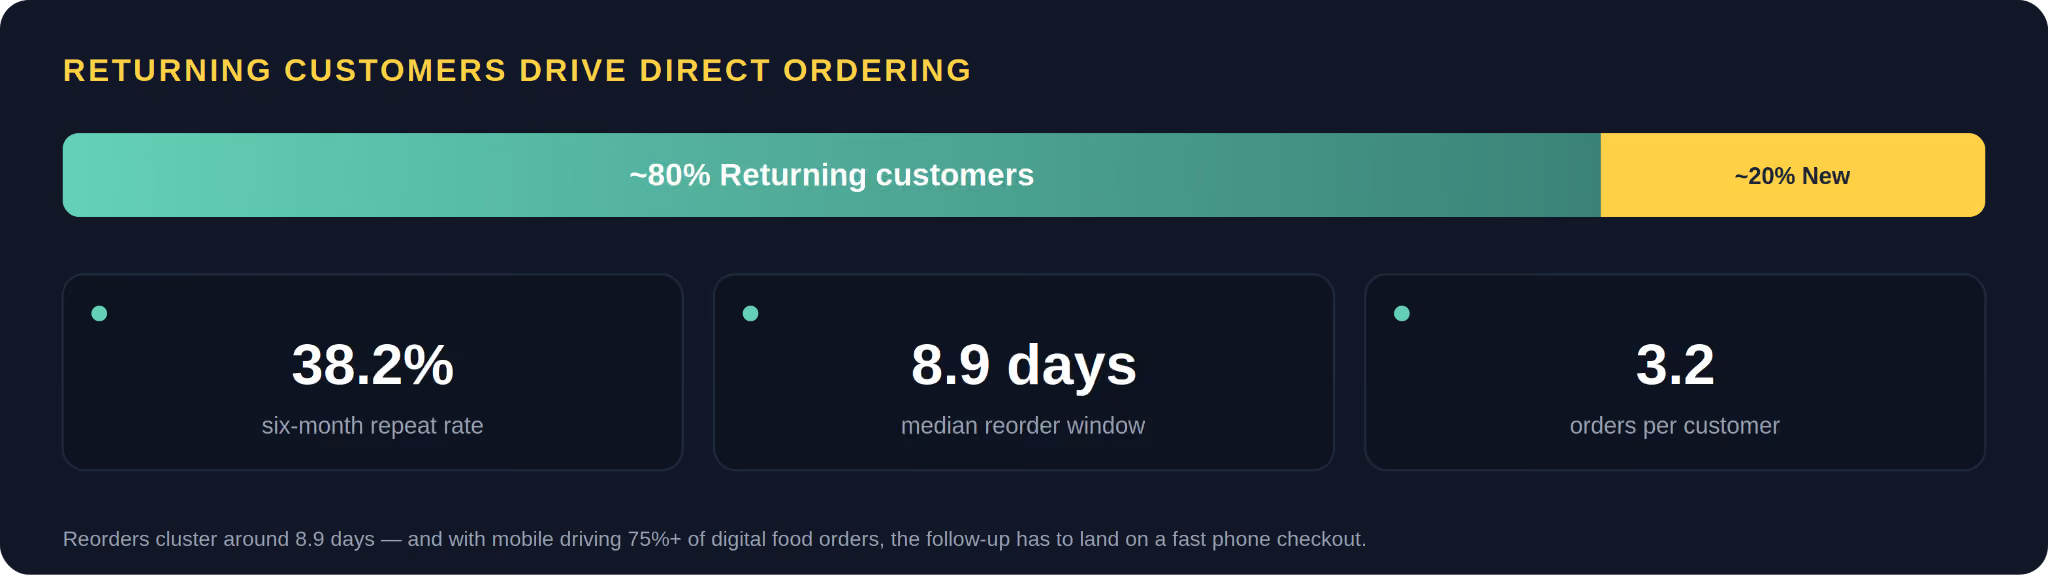
Here is where the trend story turns practical. Wait too long to re-engage a guest and you miss the natural reorder moment. Move too early and the nudge lands before they are ready. The 38.2% six-month repeat rate tells you repeat behavior is real but not automatic, which means follow-up messaging is doing work, not running on its own. Since mobile drives more than 75% of U.S. digital food orders in 2025, that follow-up has to lead to a fast, frictionless reorder on a phone. A slow mobile checkout quietly cancels the whole retention effort.
For the mechanics of turning first orders into repeat ones, a restaurant loyalty program guide pairs well with this reorder timing data.
Which days and dayparts drive the most orders?
Friday leads the week, Thursday and Saturday follow, Monday is the quietest, and lunch plus dinner are the two windows where the kitchen needs to be ready.
Timing works in two layers, and both matter for how you run the line. The first layer is the day of week. The second is the daypart. The point is not simply that Fridays are busy. It is that you can predict when ordering pressure rises, then put your strongest staffing and promo support exactly there.
The second layer connects daypart to fulfillment behavior. Lunch and dinner are the biggest windows overall. Late-night ordering skews more toward delivery in certain categories, pizza especially, so it does not behave like a smaller version of dinner.
Treating every hour the same is the quiet mistake here. A Monday lunch and a Friday dinner are not the same operational event, and staffing them identically wastes labor on one end and strains it on the other. Use the slow Monday for prep and planning, then put your best hands and your promo weight into the Friday-to-Saturday stretch. If you want segment-level nuance by cuisine, restaurant online ordering statistics go deeper than platform averages.
What should restaurants do with these trends?
Staff for the peaks, protect the pickup flow, and time retention messaging around the short reorder window that follows a first order.
When order volume is predictable, labor planning stops being a guess and becomes a calibration. You already know Q1 and Q3 run hot and the middle of the year cools, so build your schedules and your promo calendar against that shape rather than discovering it in real time.
When the fulfillment split is stable near 40/60, you can improve both pickup and delivery instead of betting one will eventually win. Tighten the pickup handoff, since that is the larger share, and keep delivery accuracy high so the smaller path still protects your margin and your reviews.
When returning guests drive most orders, post-purchase timing becomes one of your highest-value levers. A reorder window that clusters around a little over a week tells you when to send the reminder or the offer, before the moment fades. That is a retention cadence, not a broadcast.
Keep the thinking grounded in operations: menu visibility, prep pacing, handoff accuracy, and re-engagement timing. These trends reward consistency more than clever campaigns. Operators who keep the experience smooth during the busy windows and follow up quickly after a first order are the ones who keep repeat demand moving. Beyond the operational upside, restaurants offering online ordering report up to 30% higher revenue growth than offline-only businesses, which makes getting these fundamentals right worth the effort.
How does Restolabs help restaurants own direct ordering?
Restolabs supports direct ordering ownership with tools that help restaurants keep customer data, streamline ordering, and reduce reliance on third-party channels.
Acting on these trends takes a system built for owned ordering, not one that hands your customer relationships to a marketplace. Restolabs is designed so restaurants control their customer data, run a clean pickup and delivery flow, and keep the day-to-day simple enough to actually manage. That is the setup that lets you staff for the peaks and time your reorder follow-ups without stitching tools together.
Ready to take back your online ordering? Book a Demo

Sruthi Sekar specializes in brand strategy, growth, and user experience in the hospitality industry. As the driving force behind Restolabs, she helps restaurants harness technology to scale and thrive. With a background in design, branding, and entrepreneurship, she brings a sharp focus on crafting digital experiences that drive real business impact.
Frequently Asked Questions
Direct ordering trends in 2026 are shaped by seasonality, a stable pickup and delivery mix, and strong repeat behavior. For restaurants, the biggest signal is not just more digital orders, but more repeat orders from existing guests.
Yes. Our data shows pickup and dine-in at 60.1% and delivery at 39.9%, and that split stays stable through the year. Restaurants should optimize both, but pickup remains the larger share.
The strongest periods are Q1 and Q3, with a softer mid-year and summer stretch. Fridays lead the week, and lunch plus dinner are the main ordering windows.
Because returning guests drive about 80% of orders. That means restaurants get more value from fast follow-up, smart timing, and a smooth reorder experience than from one-off traffic alone.
A median 8.9-day reorder window shows that repeat orders happen quickly. Restaurants can use that timing to send reminders, offers, or re-engagement messages before the next order opportunity fades.
Use them to guide staffing, promo timing, fulfillment focus, and retention cadence. The real value of the data is in helping restaurants plan around actual ordering behavior instead of guessing.






.webp)

.svg)
.webp)