
Key Takeaways
- 2026 is less about chasing more traffic everywhere and more about reading when demand actually lands, then staffing, promoting, and retaining around those windows.
- Friday dinner is the sharpest revenue moment, while Monday is the cleanest day for win-back and loyalty recovery.
- Pickup still carries most direct-order volume for many concepts, but cuisine mix changes the playbook fast, especially for Pizza, Cafe & Coffee, Bakery & Donuts, and Grocery & Convenience.
- AOV gaps by cuisine mean some restaurants should push frequency and bundles, while others should protect basket size and margin.
- Our data shows Friday is the highest ordering day, 60.1% of orders are pickup and dine-in, and the median reorder window is 8.9 days.
What the 2026 restaurant outlook really looks like
The 2026 outlook reads resilient, but growth is uneven. Operators who own direct ordering can turn that unevenness into a planning advantage by reading demand by day, daypart, and cuisine.
The backdrop is familiar: consumers are cautious, costs stay sticky, and growth is positive but slower. The National Restaurant Association projects industry sales of $1.55 trillion in 2026 with 1.3% real gains. That is a healthy top line, but a healthy industry number does not tell you when your own guests want to buy.
This is where broad optimism stops being useful. A restaurant can look fine on paper and still miss the specific windows that carry its revenue. Spread labor, prep, and promotions evenly across the week and you underfund the moments that actually pay while overfunding the ones that do not.
Direct ordering is the part of the business you can actually steer. You control timing, guest ownership, and retention in a way you never will on a third-party marketplace. The patterns below come from more than 4,000,000 orders processed between March 2025 and March 2026, spanning 2,126 active locations across 479 brands. That is broad enough to matter for a single neighborhood spot and for a multi-location group alike.
The real 2026 story is not whether demand exists. It is when demand lands, how it splits by fulfillment, and how often the same guest comes back.
Why Friday evening is the revenue window that deserves the most attention
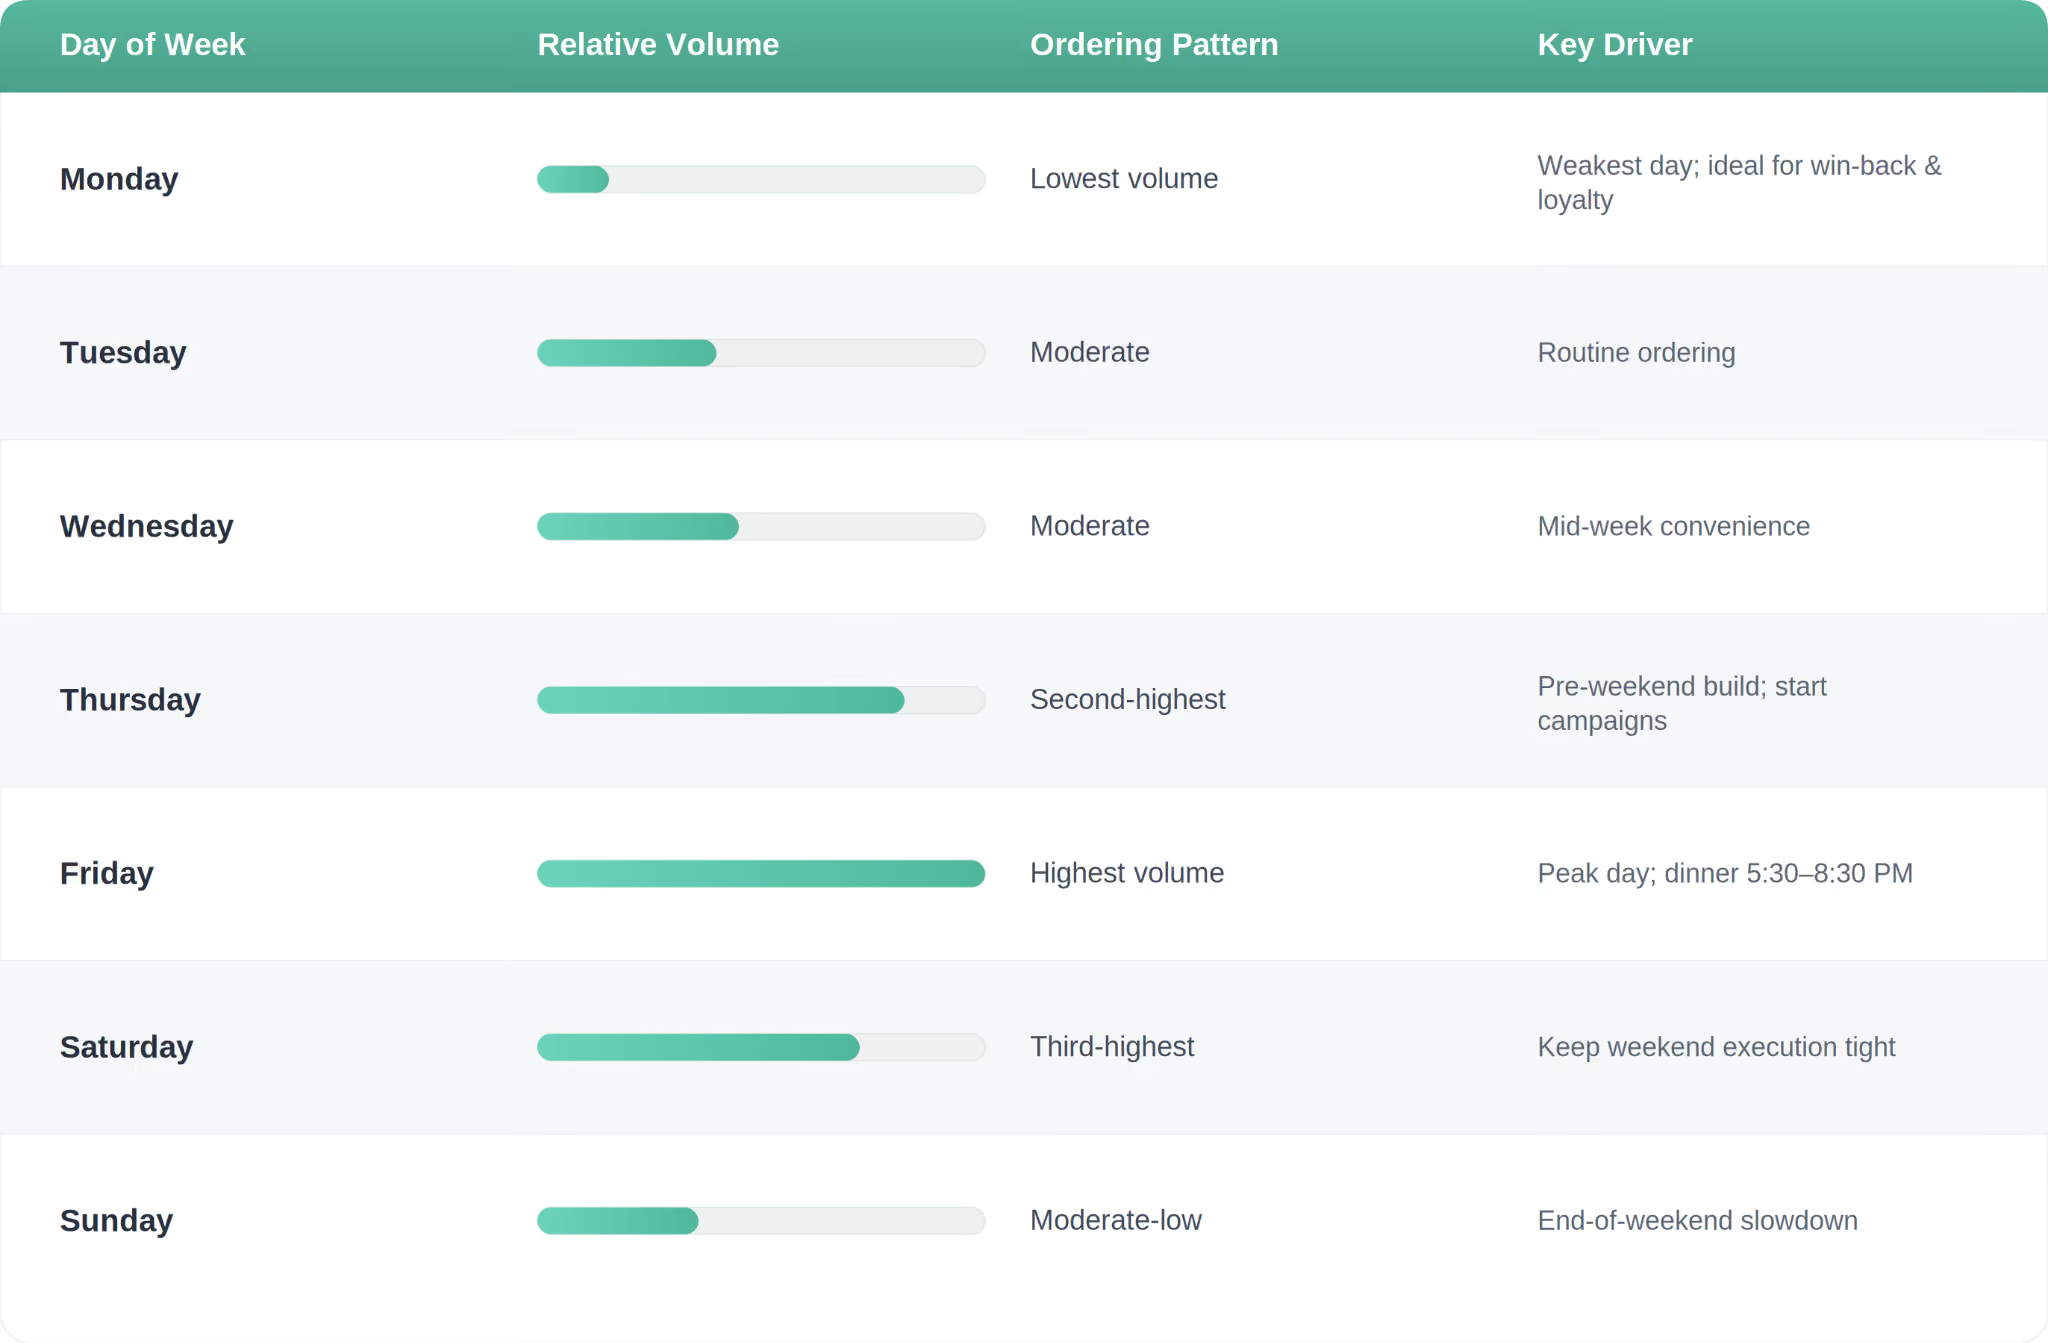
Friday is where direct ordering concentrates, and dinner is the main peak. Spreading labor, prep, and promotions evenly across the week leaves the strongest window under-supported.
Generic "weekend demand" language hides the real shape of the week. Thursday and Saturday matter, but Friday leads. Our data shows Friday as the highest ordering day, followed by Thursday, then Saturday. Treating all three the same wastes the sharpest opportunity in the calendar.
The core of Friday volume sits in the dinner window. Our data puts the main peak at 5:30 to 8:30 PM, which is exactly where labor schedules and prep timelines need to be strongest. When kitchens staff to an average shift instead of the peak, tickets slow, accuracy drops, and the busiest three hours become the worst guest experience of the week.
Two other windows deserve their own plan. The late-night 9 to 11 PM pocket skews delivery-heavy for pizza, which is a very different operational problem than dinner service and needs driver coverage rather than more front-of-house. Weekend mornings from 7 to 10 AM belong to coffee and bakery, so breakfast concepts should not get buried under a dinner-first mindset.
The practical move is to cluster promotions around Thursday and Friday evenings rather than scattering offers evenly. Push where the demand already leans.
How should the 8.9-day reorder window change retention planning?
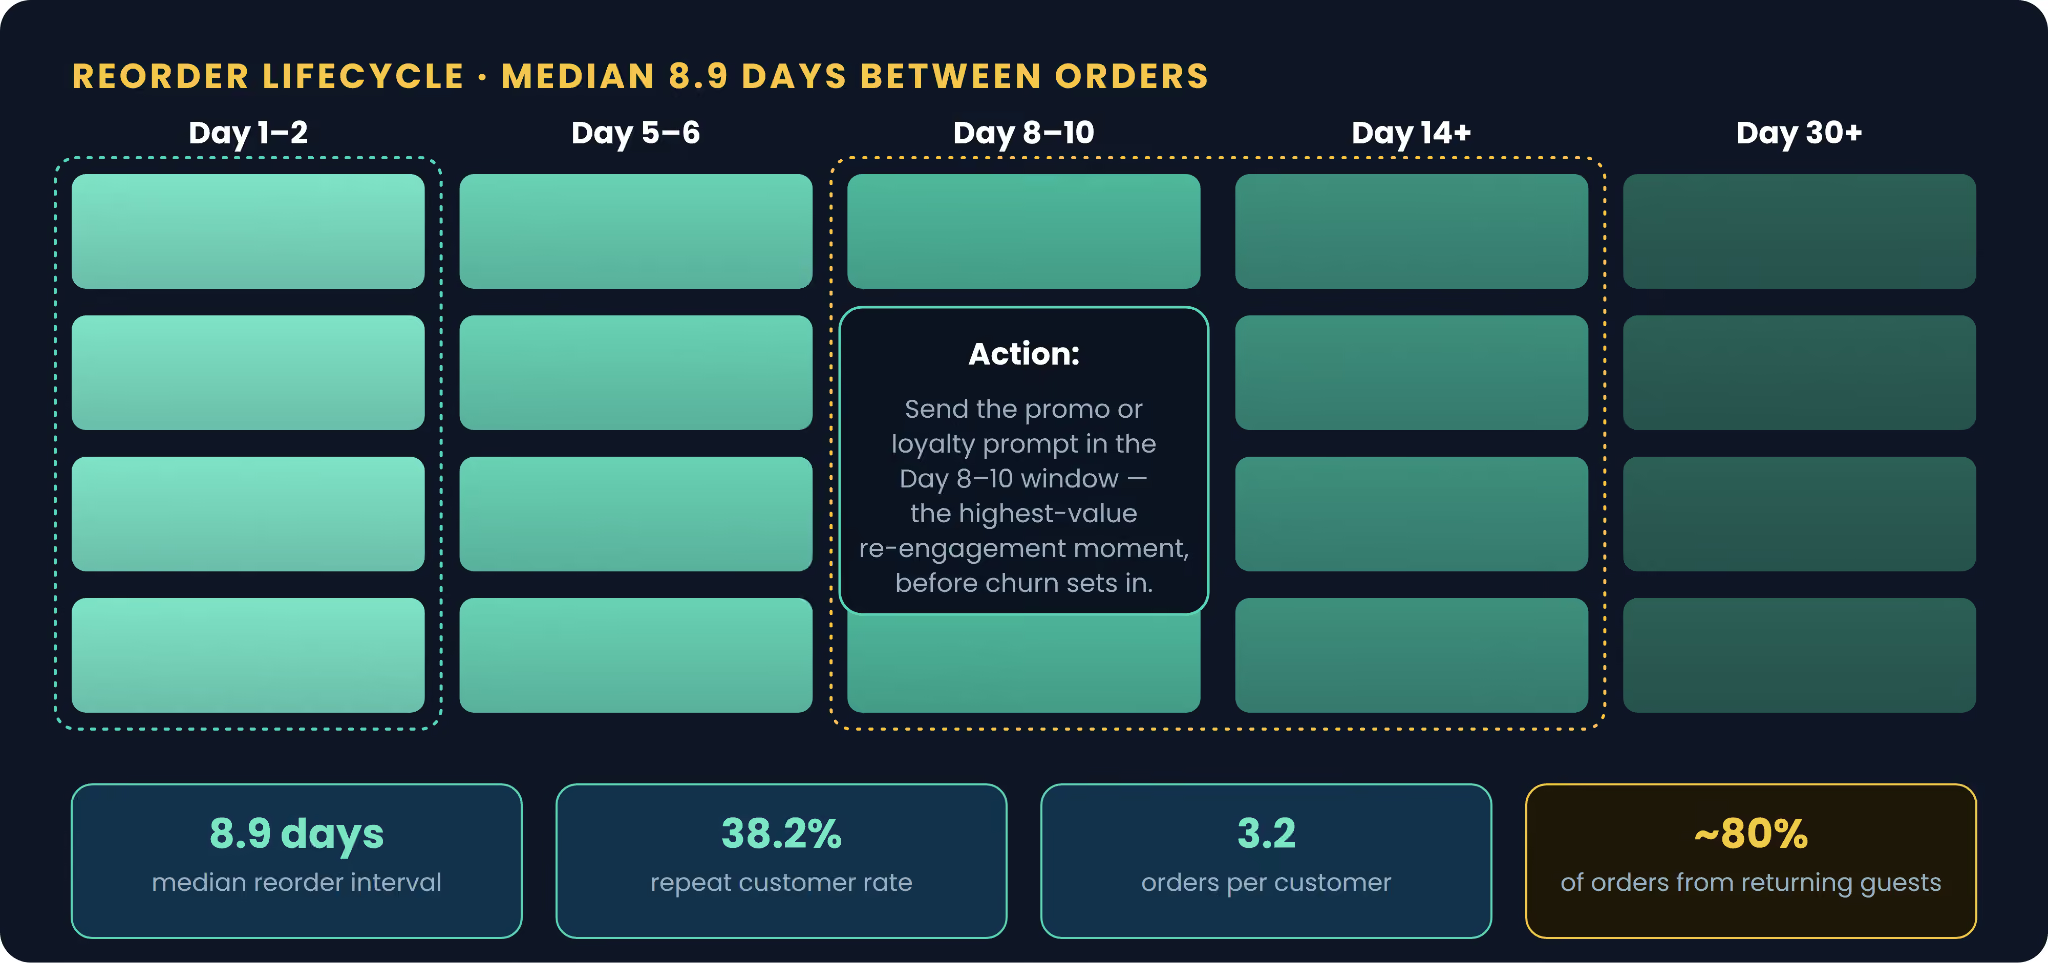
Retention should be timed to guest behavior, not sent on a generic schedule. The strongest moment to re-engage is roughly Day 7 to 10, before churn gets sticky.
Most retention advice leans on broad loyalty slogans. The order data points somewhere more specific. Our data shows a median of 8.9 days between repeat orders, a 38.2% repeat customer rate, and 3.2 orders per customer. That short cadence tells you when a message will actually land, rather than arriving after the guest has already moved on.
Map the lifecycle to that clock:
- Day 1 to 2: delight and a light upsell while the meal is fresh in memory.
- Day 5 to 6: a personalized recommendation based on what they ordered.
- Day 8 to 10: the promo or loyalty prompt, the highest-value re-engagement window.
- Day 14 and beyond: shift into win-back logic.
- Day 30 and beyond: treat as churn risk.
Compare that to a monthly newsletter that fires on the first of the month regardless of behavior. By then, a guest whose natural rhythm is nine days has already skipped two orders. The calendar was built for the sender, not the buyer.
This matters because direct-order growth in 2026 is mostly a repeat-guest problem. Our data shows returning customers drive about 80% of orders. If you want broader context, our online ordering statistics roundup puts these numbers alongside wider industry trends. Build the guest journey around the reorder clock, not a marketing calendar.
Why pickup is still the default for many restaurants, but not for every cuisine
Pickup is the dominant fulfillment choice in direct ordering, but cuisine decides how far that rule should go. One default setting for every menu leaves money on the table.
The overall split makes the center of gravity clear. Our data shows 60.1% of orders are pickup and dine-in versus 39.9% delivery. Broader industry reporting agrees on the direction: Olo found 81% of direct orders are pickup or curbside in 2025. Pickup is not a fallback. It is the practical center of direct ordering.
The averages hide sharp differences by cuisine. Coffee and bakery lean heavily on pickup and dine-in, pizza splits closer to the middle, and grocery is delivery by nature.
A high-pickup concept should not overbuild delivery infrastructure or pay for routing capacity that most guests never use. A delivery-heavy category still needs speed, tight routing, and order accuracy to protect margin on every dispatched order. Let fulfillment strategy follow menu behavior instead of a one-size preference.
How do cuisine AOV gaps shape the 2026 growth playbook?
Average order value is not evenly distributed across cuisines, so growth tactics should not be either. Low-ticket concepts need frequency and basket building, while higher-ticket concepts need order-size protection and upsell discipline.
The spread is wide. Our data puts the platform-wide AOV at $38.96, with average customer lifetime spend of $123.79 across 3.2 orders. Underneath that average, the range runs from Sandwiches & Deli at $57.77 down to Cafe & Coffee at around $15 to $20 and Bakery & Donuts at around $12 to $18.
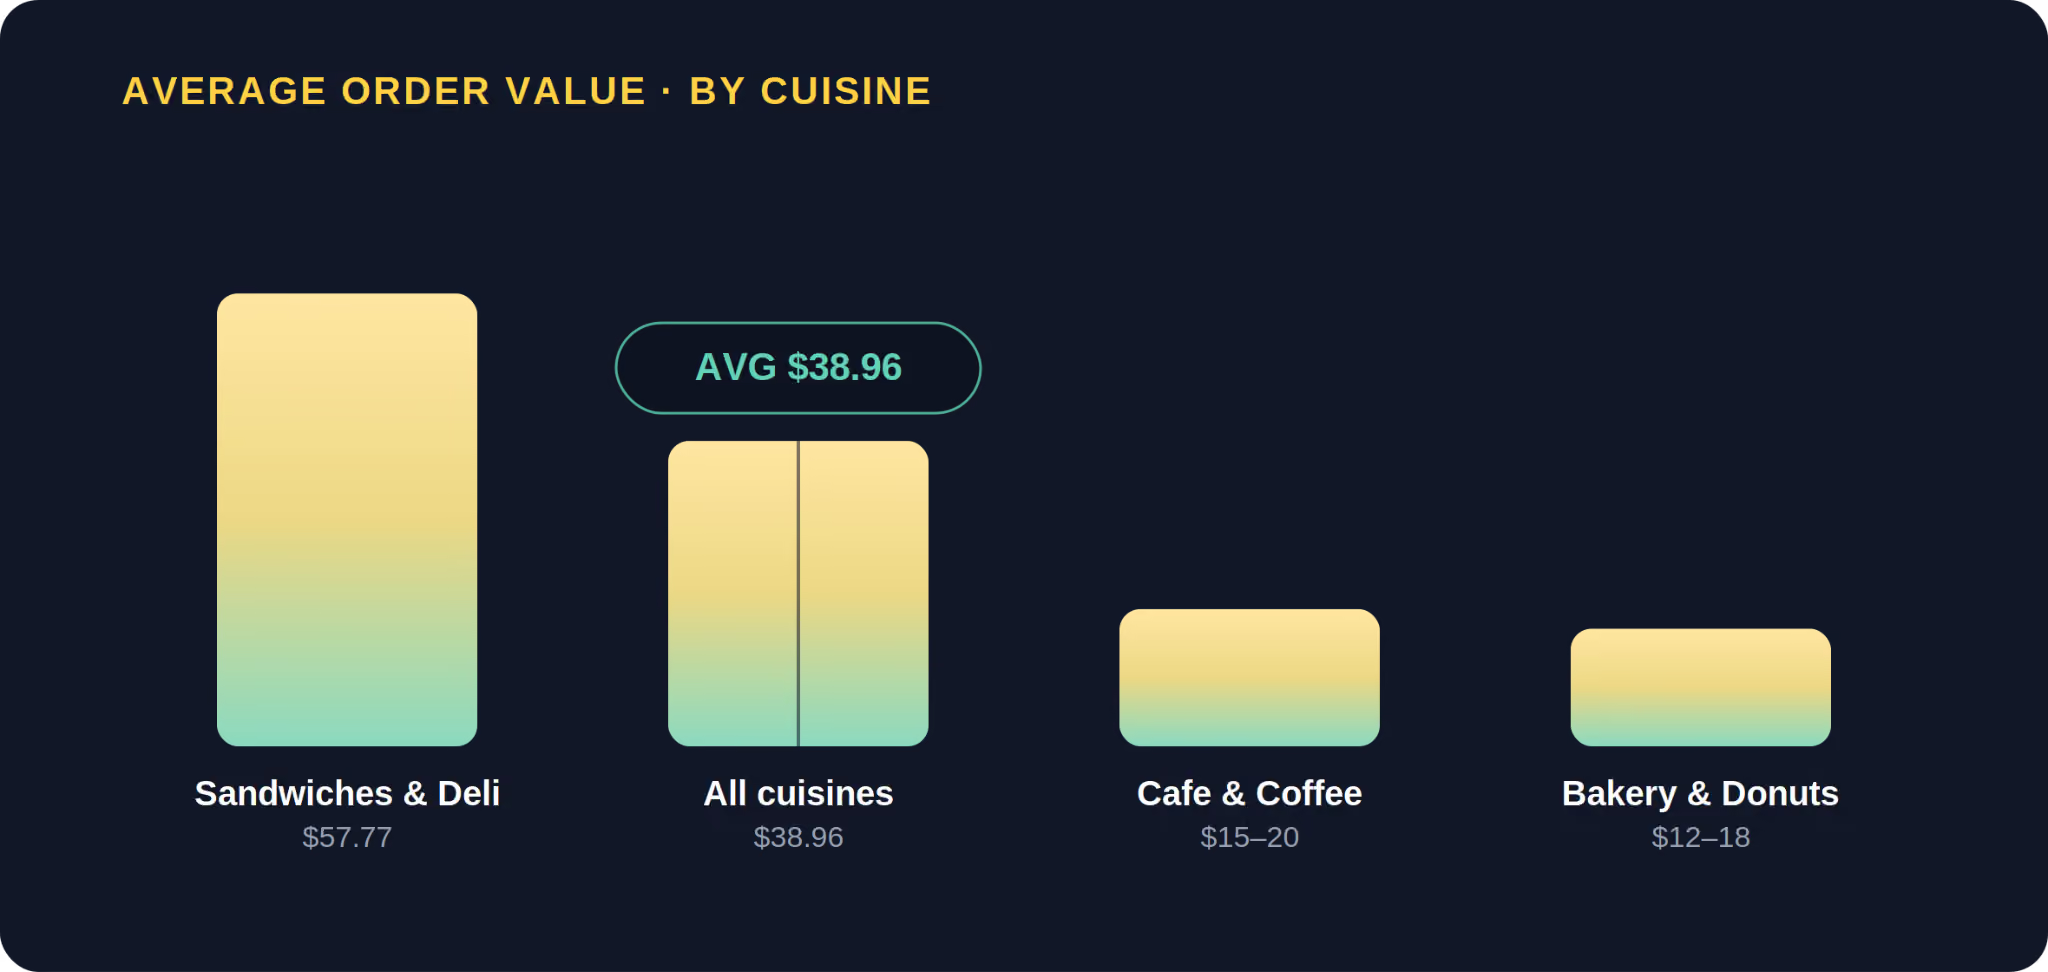
A low-AOV concept cannot survive on one-off transactions. A single $15 coffee order barely covers its own handling once fees and packaging are counted, so the whole model has to lean on repeat frequency and fast reorders. That is why the reorder clock matters most for these formats.
A high-AOV category has the opposite job. When the ticket is already $57, the leverage is in menu structure: smart bundles, clear add-ons, and order composition that nudges basket size up without discounting. For layout ideas that support that, our restaurant menu examples walk through presentation choices that influence what guests add.
Fee exposure and delivery cost do not hit every concept the same way, so match menu engineering to the economics of your cuisine rather than copying another format's playbook.
Why repeat customers matter more than new traffic in direct ordering
In direct ordering, repeat behavior carries the business. Acquisition still matters, but the faster wins in 2026 come from raising order frequency, lifetime value, and reorder timing.
Our data shows returning customers generate about 80% of orders. That single number reshapes the economics of a direct channel. If most revenue comes from people who already know you, the cheapest growth is not another ad campaign. It is one more visit from guests you already have.
The math compounds quickly. Our data puts average lifetime spend at $123.79 across 3.2 orders. Move the average from 3.2 to four orders and you have lifted lifetime value without paying to acquire anyone. That is the difference between treating direct ordering as a transaction tool and treating it as a customer-ownership engine.
This is where controlling the channel pays off. When you own the guest relationship instead of renting it from a marketplace, the timing and the offer can match real behavior: that nine-day rhythm, that Friday preference, that pickup habit. Wider 2025 consumer sentiment reinforces this shift, with 67% of consumers preferring to order directly from restaurant sites to avoid third-party fees.
Repeat guests also buy you resilience. A strong base of returning customers softens the impact of weak traffic days and uneven demand, because the revenue floor is not rebuilt from scratch every week.
What should operators do with Monday, the weakest ordering day?
Monday is not a throwaway day. It is the best moment for low-pressure recovery, win-back, and loyalty messaging, especially in coffee-heavy concepts.
Our data confirms Monday is the lowest ordering day, which is exactly why it deserves a different job than Friday or Saturday. Your best promotional inventory belongs on your busiest days, where it captures demand that is already there. Monday is where you do the quieter work.
Position it as the recovery window for churn-risk guests. It also lines up naturally with the retention clock: for many guests who ordered on a Thursday or Friday, the following Monday sits right inside that Day 7 to 10 re-engagement window. That timing overlap is a planning advantage, not a coincidence to ignore.
Coffee-heavy concepts are especially suited to Monday reactivation, since the start-of-week routine is a habit you can prompt. A low-friction "start your week" nudge often lands better than a deep discount.
Handled this way, a weak-day strategy protects revenue without diluting peak-day performance.
Our Data: Monday is the weakest ordering day, which makes it the right place for win-back and loyalty recovery. - Restolabs 2026 Online Ordering Behaviour Report
How does Restolabs help restaurants own direct ordering?
Restolabs gives restaurants a direct ordering path built around guest ownership, commission-free growth, and a simpler setup for operators who want more control.
The platform pairs branded online ordering with full customer data ownership, so the timing patterns above are yours to act on rather than locked inside a marketplace. Restaurants keep control of the direct channel, the guest relationship, and the offer, which is what makes reorder-window retention and cuisine-matched fulfillment possible in the first place.
Ready to take back your online ordering? Book a Demo

Sruthi Sekar specializes in brand strategy, growth, and user experience in the hospitality industry. As the driving force behind Restolabs, she helps restaurants harness technology to scale and thrive. With a background in design, branding, and entrepreneurship, she brings a sharp focus on crafting digital experiences that drive real business impact.
Frequently Asked Questions
It means operators should plan around where demand is strongest, not just where the macro headlines are loudest. Direct ordering gives restaurants more control over timing, guest ownership, and repeat business.
Friday is the highest ordering day in our data, with dinner from 5:30-8:30 PM as the core peak. That is the window where staffing, prep, and promotions matter most.
They should build retention triggers around Days 7 to 10, then shift into win-back logic after Day 14. The goal is to re-engage before the guest slips into churn risk.
For many concepts, yes. Overall, 60.1% of orders are pickup and dine-in. But cuisine matters, since coffee, bakery, pizza, and grocery behave very differently.
Low-AOV concepts need frequency and basket building. Higher-AOV concepts can lean harder on bundle design, upsells, and margin protection.
Returning customers drive about 80% of orders, with 3.2 orders per customer and $123.79 average customer lifetime spend. That makes retention the main growth lever for direct ordering.





.webp)

.svg)
.webp)