
.avif)
Key Takeaways
- Friday and dinner service carry the heaviest ordering load, so build labor and prep around demand instead of habit.
- Guests reorder fast, which turns the first week to ten days after a purchase into your best re-engagement window.
- Pickup and dine-in still outweigh delivery on the platform, so match channel strategy to your concept and cuisine.
- Most industry pages stay broad, but our data adds transaction proof restaurants can actually act on: 4,000,000+ orders, $34.1M in gross order value, and a $38.96 average order value.
Food ordering statistics at a glance
The biggest numbers first: more than four million orders, $34.1M in gross order value, a $38.96 average order value, and 3.2 orders per customer across a single year of direct ordering.
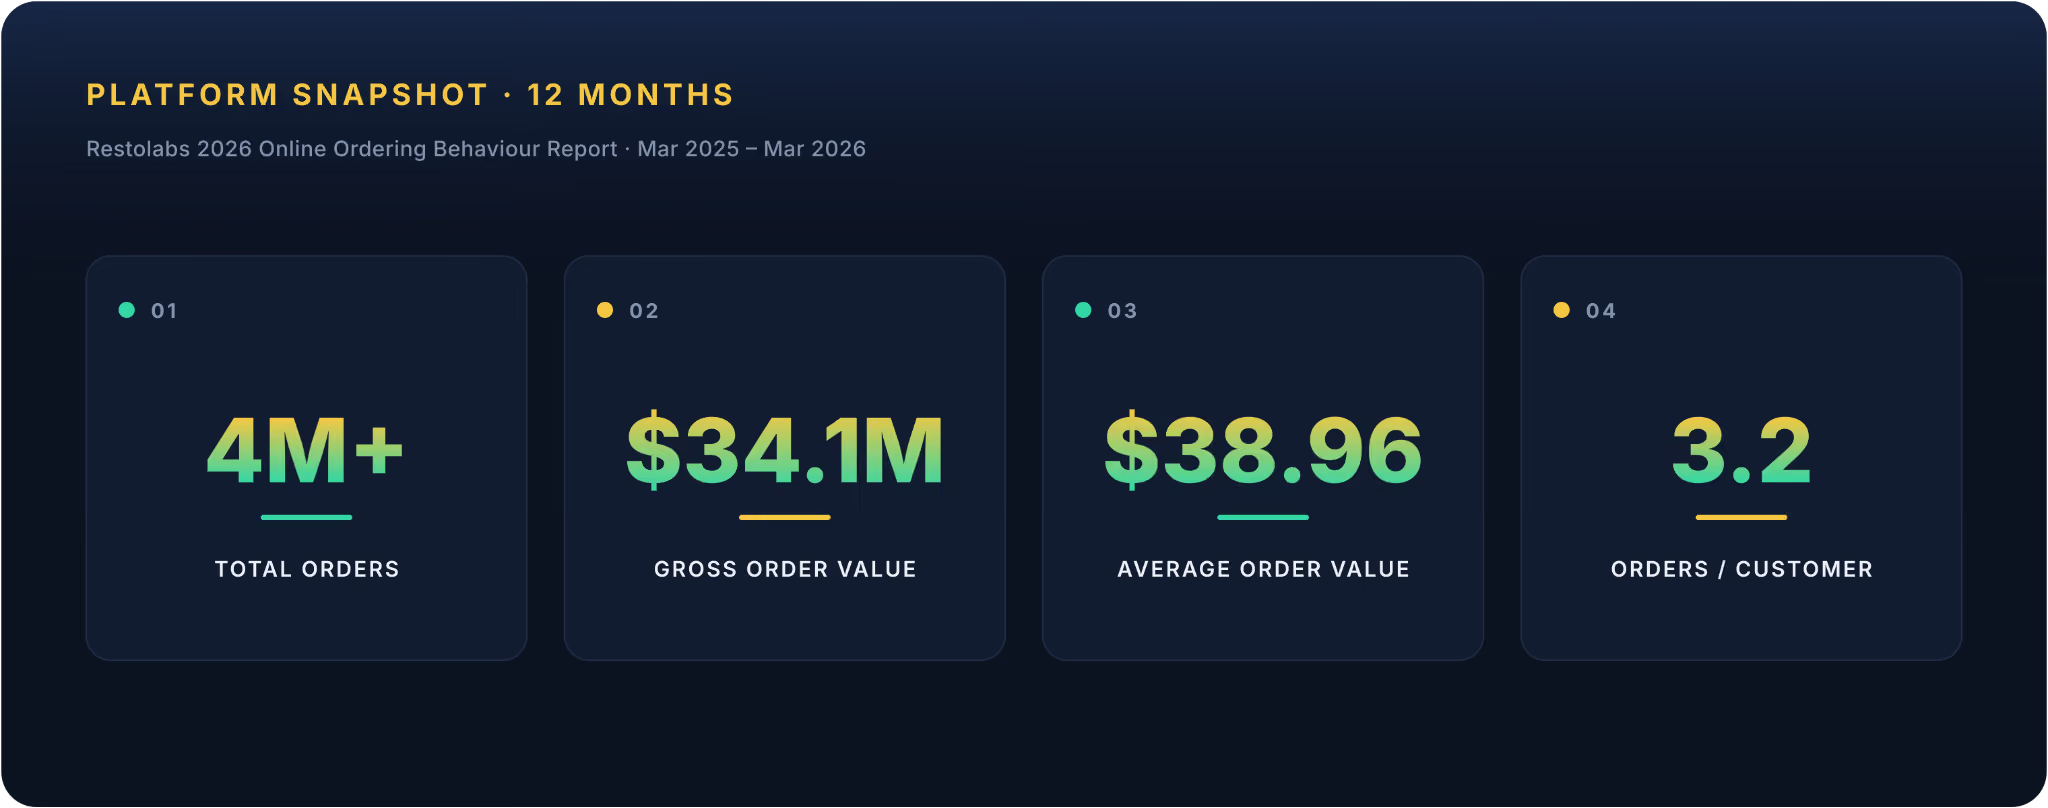
Those four figures give operators something most market reports cannot: a benchmark drawn from real transactions rather than a forecast. According to our data from the Restolabs 2026 Online Ordering Behaviour Report, direct ordering is not just growing in theory. It is producing measurable revenue at scale, across thousands of restaurant locations.
That distinction matters when you are deciding where to invest. A projection tells you the market is big. Transaction data tells you what an actual guest basket looks like, how often they come back, and when they place the order.
For context, digital ordering has become routine rather than occasional. Industry analysts estimate that 60% of U.S. customers order online at least twice a week in 2026, which tells you the demand is there. The question for most restaurants is no longer whether guests will order online, but how much of that revenue they get to keep.
Read these numbers together and they start shaping decisions. A $38.96 average basket sets a baseline for whether your upsell prompts and menu structure are pulling their weight. And 3.2 orders per customer is a reminder that your pricing and retention plan should be built around lifetime value, not a single first order.
When do guests order most?
Friday is the highest ordering day, Thursday and Saturday follow close behind, and Monday is the weakest. Dinner service from 5:30 to 8:30 PM is the clear peak across the platform.
That pattern should drive your staffing and prep schedule directly. If your labor plan treats every weekday the same, you are overstaffing Monday and scrambling on Friday night. Our data from the Restolabs 2026 Online Ordering Behaviour Report shows demand concentrates in predictable windows, so the schedule can follow it.
There is a late-night layer worth noting. Between 9 and 11 PM, ordering skews heavily toward delivery and toward pizza in particular. Most food ordering coverage treats delivery demand as if it spreads evenly through the evening, but the order data shows sharp spikes by day and by daypart. That gap is where a lot of missed revenue hides.
The strongest promotions are usually the ones matched to the right day and the right service window. A slow Monday responds better to a targeted recovery offer than a blanket discount, and a Thursday push can build momentum into the weekend peak instead of fighting against it. For more on timing your campaigns, Restolabs' guide on the best time to send promotional newsletters breaks it down further.
What does repeat ordering look like?
Guests come back faster than most operators expect. Our data shows a 38.2% repeat rate over a six-month lookback, a median gap of 8.9 days between repeat orders, and 3.2 orders per customer.
Put those three numbers together and a clear window appears. If the typical returning guest reorders within about nine days, then day 7 to 10 after a purchase is the moment to reach out. Wait longer and you are re-engaging someone who has already decided, or already drifted.
The returning-customer share changes the strategy even more. According to our data from the Restolabs 2026 Online Ordering Behaviour Report, returning customers account for roughly 80% of orders. New traffic still matters, but owned-channel revenue gets healthier when you build around repeat rhythm rather than chasing one-time acquisition. Most articles frame retention as a loyalty nicety; the order data treats it as the core of the business.
This is where email, SMS, and loyalty timing earn their keep. An offer that lands on day 8, tied to what a guest ordered last time, has a real chance of catching them before the decision is made. The strongest retention play is almost always the one launched before the guest drifts away, and a restaurant loyalty program built around that cadence compounds over time.
Pickup, dine-in, and delivery: which mix wins?
Pickup and dine-in together account for 60.1% of orders on the platform, while delivery makes up 39.9%. Direct ordering is not just a delivery story, and treating it that way leaves money on the table.
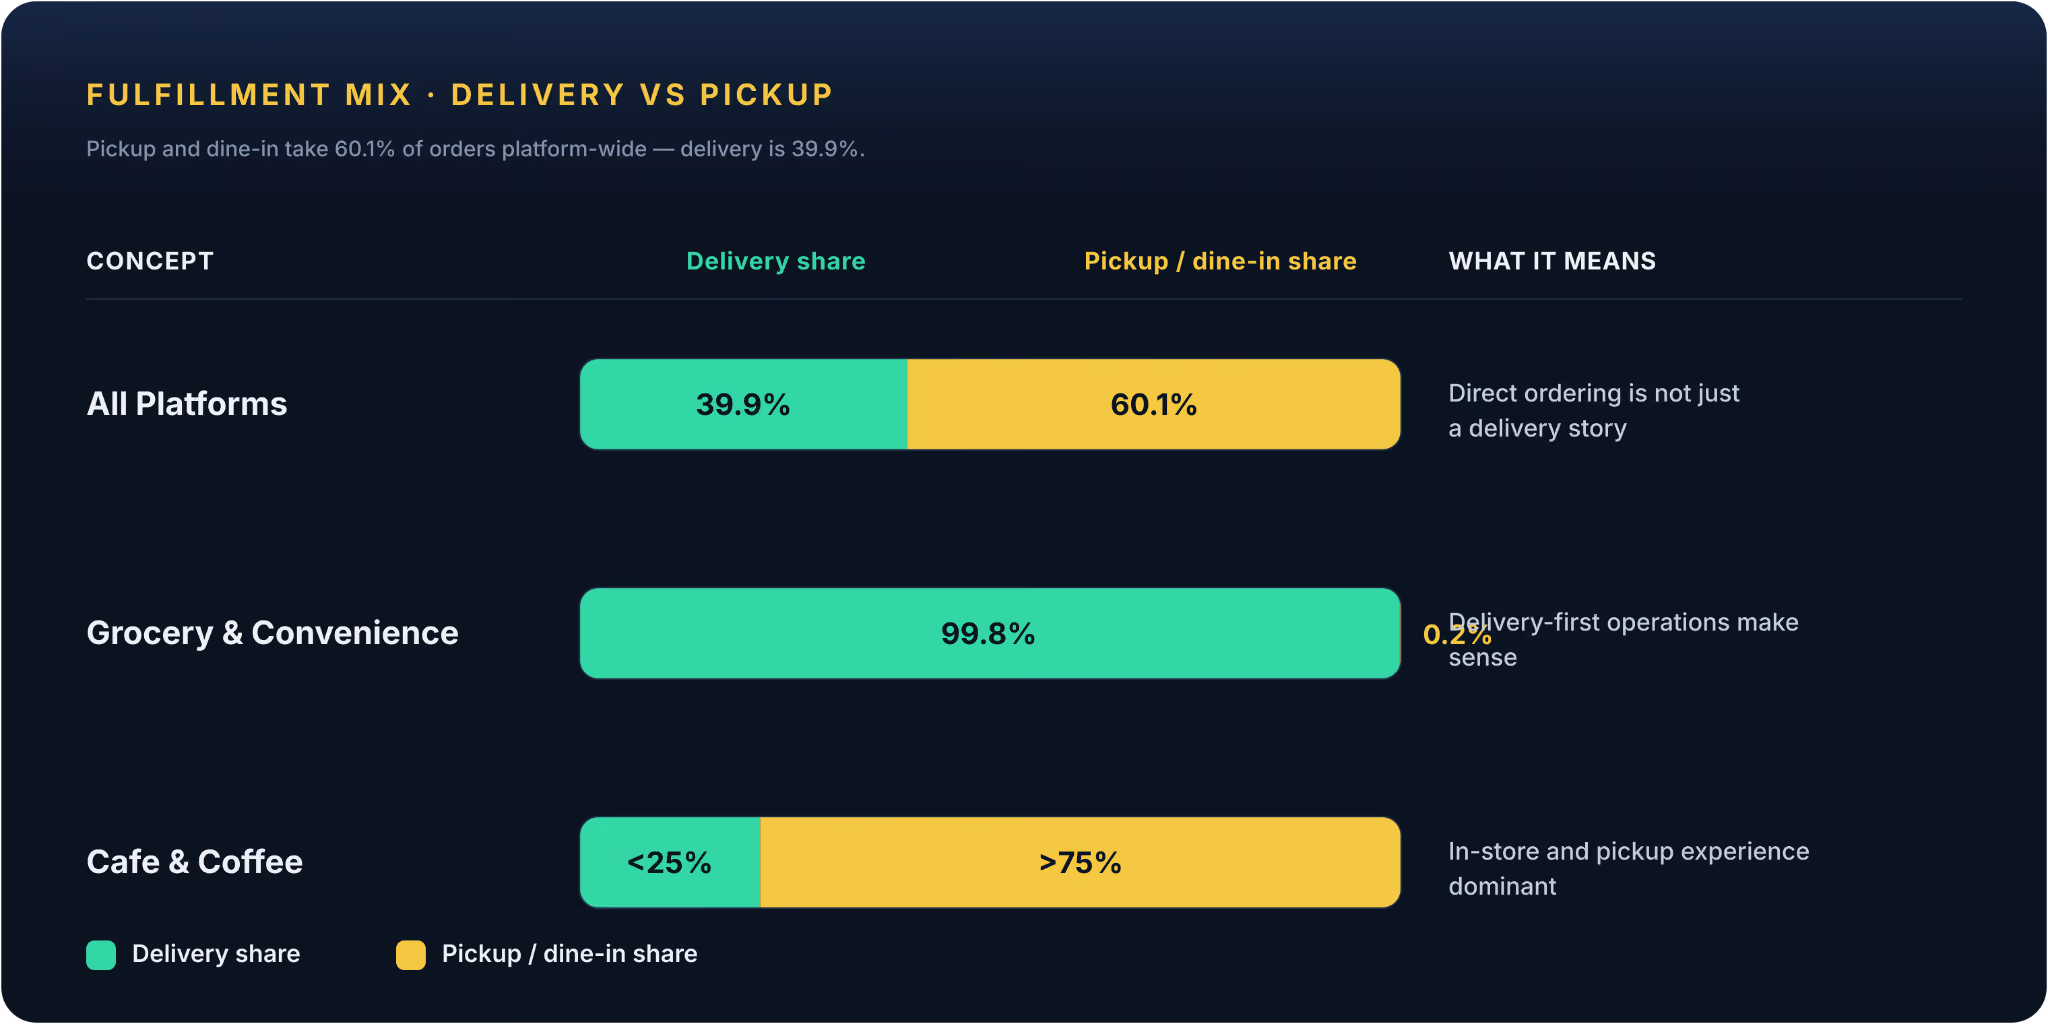
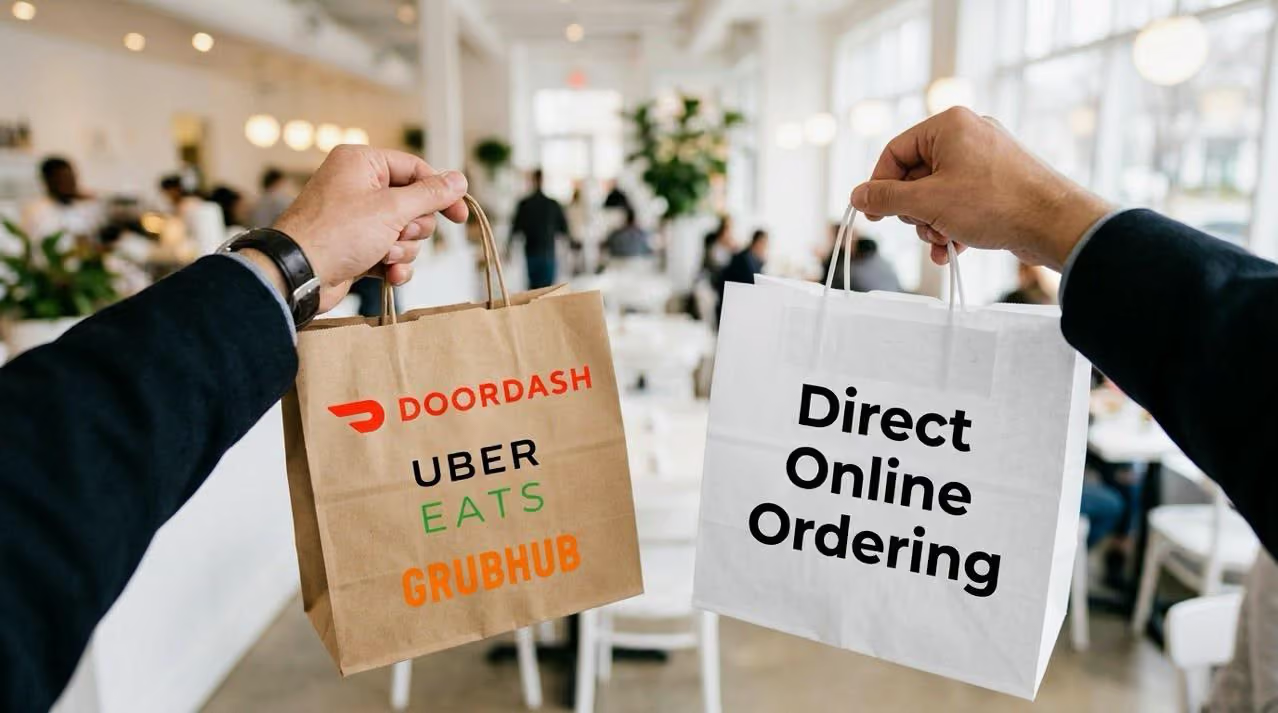
Most food ordering articles over-index on delivery, but the balance in our data tells a fuller story. For plenty of concepts, the most valuable orders are the ones guests collect themselves or eat on-site, where there is no third-party fee eating into the margin. That reframes the whole channel question.
The category split matters even more than the platform-wide mix. Grocery and convenience is almost entirely delivery, while cafe and coffee leans hard toward pickup and dine-in. Apply a single channel assumption across every concept and you will misread how your guests actually want to order.
Fulfillment strategy ripples through everything else. It shapes menu design (a delivery-heavy concept needs packaging-friendly items), staffing (a pickup-heavy cafe needs speed at the counter), and the constant balance between service speed and margin. Get the channel read right and the rest of the operation gets easier to plan.
Which categories and regions matter most?
Food ordering statistics are not one-size-fits-all. Pizza leads platform volume at 1.35M orders, roughly 29% to 30% of the total, while Sandwiches and Deli posts the highest average order value at $57.77.
That contrast is the whole point. A high-volume category like pizza and a high-basket category like sandwiches win in different ways, and comparing them on a single metric misleads you. Cafe and Coffee and Bakery and Donuts sit lower on average order value, but that is not a weakness. Those concepts make it up through repeat frequency and lifetime spend, so a smaller basket ordered often can outperform a larger basket ordered rarely.
Geography adds another planning lens, especially for multi-location brands. According to our data from the Restolabs 2026 Online Ordering Behaviour Report, the most relevant market clusters are the United States, Europe, the United Kingdom, Singapore, and the UAE, and the platform spans 2,126 active locations across 479 brands. That gives the numbers real weight for anyone weighing expansion, regional menu fit, or cross-market performance.
The context is what makes the numbers usable. Category and regional behavior tell you where to push pickup, where to lean on delivery, and where to focus on basket-building. A pizzeria and a coffee shop should not run the same digital playbook, and the data makes that obvious.
Why are these numbers reliable?
These benchmarks come from real activity, not broad market estimates. Our March 2025 to March 2026 dataset includes 97.4% timezone-matched orders, which is 3,896,000 of more than four million orders, across 2,126 active locations.
That level of coverage is what separates an operational benchmark from a headline projection. When 97.4% of orders are matched to the correct local time, the daypart and day-of-week patterns hold up. You can trust that the Friday dinner peak is a real pattern and not an artifact of mismatched time zones.
If you want to compare your own order flow, timing, or basket size against a credible reference point, this is the evidence base that makes the comparison meaningful. Reliable operational data is what turns a page of statistics into something you can actually plan around.
How Restolabs helps restaurants own direct ordering
Restolabs helps restaurant teams turn these benchmarks into a channel they control. When operators own their ordering, watch basket behavior in real time, and plan around real guest timing, the numbers stop being abstract and start shaping daily decisions.
The platform is commission-free and built for full ownership of customer data, so the repeat rhythm and basket trends covered here become yours to act on. Teams that want to see how direct online ordering launches and runs without leaning on outside marketplaces can walk through the full path in a demo.
Ready to take back your online ordering? Book a Demo

Sruthi Sekar specializes in brand strategy, growth, and user experience in the hospitality industry. As the driving force behind Restolabs, she helps restaurants harness technology to scale and thrive. With a background in design, branding, and entrepreneurship, she brings a sharp focus on crafting digital experiences that drive real business impact.
Frequently Asked Questions
Focus on order volume, gross order value, average order value, repeat rate, and ordering time windows. Those five metrics tell operators more about revenue potential than broad market forecasts alone.
A good average order value depends on concept and channel, and category matters more than a single universal benchmark. Sandwiches and Deli can run much higher than cafe or bakery concepts, so compare like for like.
Our data shows a 38.2% repeat rate over six months, with a median 8.9 days between repeat orders. That means the first 7 to 10 days after purchase are especially important for re-engagement.
Friday is the highest ordering day, and dinner from 5:30 to 8:30 PM is the main peak. Late-night ordering is also important for delivery-heavy concepts like pizza.
Pickup and dine-in account for 60.1% of orders in our data, while delivery makes up 39.9%. The right mix depends on the concept, because category behavior changes sharply.
The benchmarks come from 4,000,000+ orders, 97.4% timezone-matched coverage, and 2,126 active locations. That makes them strong for operational comparison and planning.






.webp)

.svg)
.webp)