
.jpg)
Key Takeaways
What food trends matter for restaurants in 2026?
The trends worth your attention in 2026 are the ones that change what guests buy, when they buy, and how they want it fulfilled: value-seeking behavior, off-premises demand, global flavors, and tighter margin management.
Most trend roundups open with food culture, the ingredient of the year or a flavor everyone will supposedly crave. That is readable, but it rarely tells you whether to add a prep cook on Fridays or push a bundle on a slow Monday. The trends that actually move a restaurant are the ones that reshape labor, prep, and channel mix.
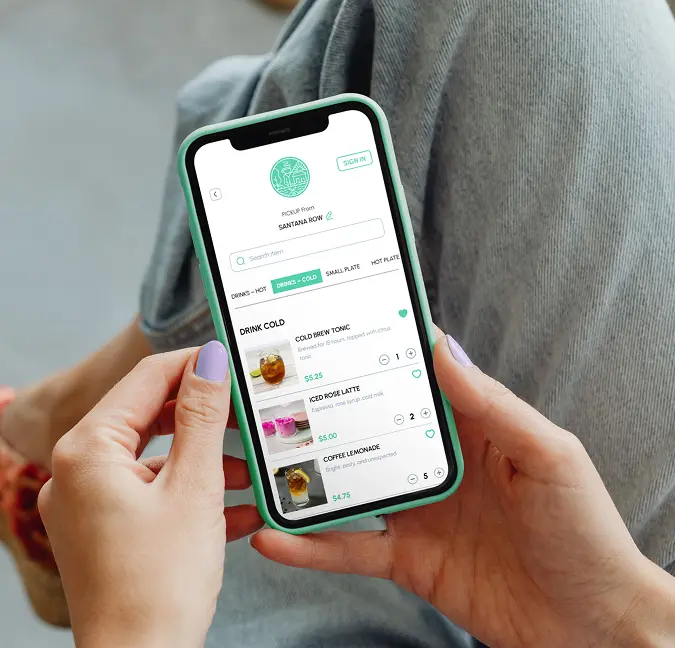
Off-premises dining now drives about 75% of restaurant traffic, according to National Restaurant Association data cited by Clearcogs in 2026. That single number reframes most of what follows. If three of every four visits happen through takeout, pickup, or delivery, then your menu, packaging, and timing decisions all live on the ordering screen, not just in the dining room.
Value has become the quiet organizing principle behind most 2026 order decisions. Around 60% of diners now trade down to cheaper restaurants rather than stop eating out, according to Truth Agency's 2026 State of the Restaurant Industry report. People are still ordering. They are just more selective about where the money goes.
Our own ordering records tell the same story from the inside. The diner in 2026 is repeat-minded and value-aware, and the demand curve is more concentrated than trend headlines suggest.
The practical read: let demand patterns drive menu planning and staffing, and treat every popular food headline as a hypothesis you test against what your guests actually order.
Why is price pressure still shaping what guests order?
Value is still the force behind most 2026 menu decisions, and it changes both what people pick and how often they come back. Guests are not hunting for cheap. They want meals that feel worth the money.
The distinction matters. A guest cutting back does not automatically choose the lowest-priced item. They choose the order that feels like a fair trade for the spend. That is why menu engineering, portion logic, bundles, and price architecture matter more than a blanket discount. Around 68% of U.S. consumers are cutting back on restaurant dining in 2026, according to PopMenu, and 42% of operators said their restaurants were not profitable in 2025, per NRA data cited by Clearcogs. Squeezed on both sides, the answer is rarely to strip the menu bare.
Our data suggests consistency beats one-time traffic spikes. When most volume comes from people who already know and trust you, protecting the value they expect matters more than chasing new faces with steep offers.
Price pressure also shows up differently by concept. A sandwich shop absorbs a small price increase very differently than a coffee shop living on volume. The spread in average order value tells you where you have room to move and where you do not.
A higher-ticket concept can build a bundle that raises perceived value without a raw discount. A low-ticket, high-frequency concept protects margin by earning one more visit a month, not by cutting the price of a $4 coffee. Same trend, two very different playbooks.
How should restaurants use protein, fiber, and functional cues?
Treat protein and fiber as menu signals that help a guest decide faster and feel confident about the order, not as wellness slogans. The goal is a clearer buying decision.
Here is the difference in practice. A dish described as "grilled chicken and quinoa bowl, 38g protein" does more work than "healthy bowl." One tells a hurried lunch buyer exactly what they get. The other asks them to guess. Naming protein content, fiber, or a filling grain gives the guest a reason to commit, especially on a pickup order where they cannot see or smell the food first.
This matters most for concepts that live on frequency. A breakfast or lunch spot does not win by charging more. It wins by being the easy, repeatable choice three mornings a week. Functional cues make that repeat decision faster.
Global flavors fold into the same logic. Around 70% of operators report rising demand for global flavors, and 74 to 78% say those dishes can command premium pricing, according to Restaurant India. That premium is only real if the menu language earns it. A well-framed dish name paired with a clear cue, such as heat level or a familiar protein, closes the gap between curiosity and purchase.
The useful question is not whether a dish is "healthy." It is whether the words on the screen help a guest choose it again next week. If you are rethinking how items read on the page, Restolabs' guide to restaurant menu examples walks through framing and placement in practical terms.
When do customers order most in 2026?
Demand clusters around a few reliable windows. Friday leads the week, Thursday and Saturday follow, and dinner from 5:30 to 8:30 PM is the sharpest peak. Food trends work best when they match this clock.
You can have the smartest bundle and the cleanest menu, but if the offer lands at the wrong hour, it wastes prep and staff. The demand curve should drive staffing, promotion timing, and prep, not the calendar out of habit.
Monday is the quietest day in our data, which makes it the wrong place for a big demand push and the right place for retention. Send the win-back offer when volume is low, not when the kitchen is already slammed.
Late-night is where a trend becomes a concrete operating decision. Late-night sales at limited-service restaurants are growing more than 10% per year, according to Santiago & Company via Clearcogs, and our data shows the 9 to 11 PM window runs delivery-heavy for pizza. If you run a pizzeria and close online ordering at 9, you are handing that growth to whoever stays open. Extending availability by an hour or two is not a marketing idea. It is a schedule decision that captures demand you already have.
Why is retention the real growth lever for direct ordering?
A trend only pays off if it creates a second order. Repeat behavior is where direct ordering stops being a spike and starts compounding into durable revenue.
First-order excitement fades fast. A guest tries the new bowl, enjoys it, then drifts back into their default habits unless something brings them back inside the right window. That window is narrower than most operators assume.
Our 38.2% repeat rate over a six-month lookback sits above the 35% strong benchmark, so direct-ordering guests are more loyal than the broad market pullback would suggest. But the median gap between repeat orders is 8.9 days. That means your message needs to land around Day 7 to 10, before the guest slips into another routine. Wait until Day 14 and you are in win-back territory. Wait past Day 30 and you are looking at churn.
This reframes the value math. When 68% of consumers are cutting back per PopMenu and 42% of restaurants ran unprofitable in 2025 per NRA data via Clearcogs, an existing customer who orders once more is worth far more than an expensive new one who never returns. Retention is not the cleanup crew after acquisition. It is the growth engine.
So the practical move is to time your outreach to the 8.9-day rhythm. A well-placed nudge on Day 8 does more for revenue than another discount blasted to strangers.
How do food trends differ by category?
One forecast does not fit every restaurant. Pizza, cafe, bakery, sandwiches, and convenience-style ordering behave very differently on fulfillment, timing, and ticket size, so each trend needs a category lens.
Treating restaurant demand as one uniform pattern is the fastest way to misread a trend. A delivery-heavy concept and a pickup-heavy one live in different worlds, even when they sell food at similar prices.
Pizza is the clearest case of trend and timing overlapping. It carries roughly a third of platform volume and peaks on weekends and late at night, so a pizzeria's biggest 2026 lever is extended hours, not a new topping. Cafe and bakery flip the logic entirely. With more than 75% and 80% pickup and dine-in share, they win on how often a regular comes back, not on ticket size. Chasing AOV there misses the point.
Grocery and convenience sits at the far end at 99.8% delivery, which means the whole fulfillment promise is different from a typical restaurant. And a sandwich concept at $57.77 AOV has room to build value into a bundle that a $4-coffee shop simply does not. The lesson is to judge each trend through your own category economics before you act on it.
How does Restolabs help restaurants act on these trends?
Restolabs gives restaurants a commission-free direct ordering system built to act on the timing, retention, and fulfillment patterns covered above, while keeping full ownership of customer data. That data is what lets you nudge a guest on Day 8 or extend late-night hours based on real demand rather than guesswork. The full Restolabs 2026 Online Ordering Behaviour Report is the deeper benchmark behind every number in this article.
Ready to take back your online ordering? Book a Demo

Sruthi Sekar specializes in brand strategy, growth, and user experience in the hospitality industry. As the driving force behind Restolabs, she helps restaurants harness technology to scale and thrive. With a background in design, branding, and entrepreneurship, she brings a sharp focus on crafting digital experiences that drive real business impact.
Frequently Asked Questions
The biggest 2026 trends for restaurants are value-seeking behavior, off-premises demand, late-night ordering, global flavors, and a tighter focus on retention. Each one changes what guests buy, when they buy, and how they want it fulfilled.
Price pressure pushes operators toward portion sizing, bundles, menu architecture, and clearer item framing so the order feels worth the spend. The goal is protecting perceived value, not stripping the menu.
Friday is the strongest ordering day, Thursday and Saturday follow, and dinner from 5:30 to 8:30 PM is the most important peak. Monday is the quietest day, making it the best fit for retention and loyalty offers.
Use protein and fiber as menu signals that help guests decide faster and feel confident about the order. They work best on pickup-led and repeat-frequency concepts.
A 38.2% repeat rate is above the 35% strong benchmark. With a median gap of 8.9 days between orders, Day 7 to 10 is the best re-engagement window.
Our data spans 4,000,000+ orders across 2,126 active locations and 479 brands, with 97.4% timezone-matched orders.
.jpg)
.jpg)
.jpg)



.webp)

.svg)
.webp)