
.gif)
.jpeg)
Key Takeaways
It’s Friday night. Your tables are full, the kitchen’s swamped, and that truffle mac and cheese is selling like crazy. But here’s the kicker: is it even profitable?
If you’ve ever had to guess which dishes truly drive your margins or which hours eat into payroll, you’re not alone. Data takes out the guesswork: showing what’s working, what’s dragging you down, and where to focus your next move.
The good news is that you don’t need a full-time analyst or a complicated tool to start. Today’s restaurant sales analytics platforms are built for operators, not data nerds. They surface the insights that help you price smarter, staff better, and promote with purpose.
In this blog, you’ll see how restaurant performance analytics helps you make smarter menu, staffing, and marketing decisions and how sales forecasting for restaurants turns patterns into predictable profit.
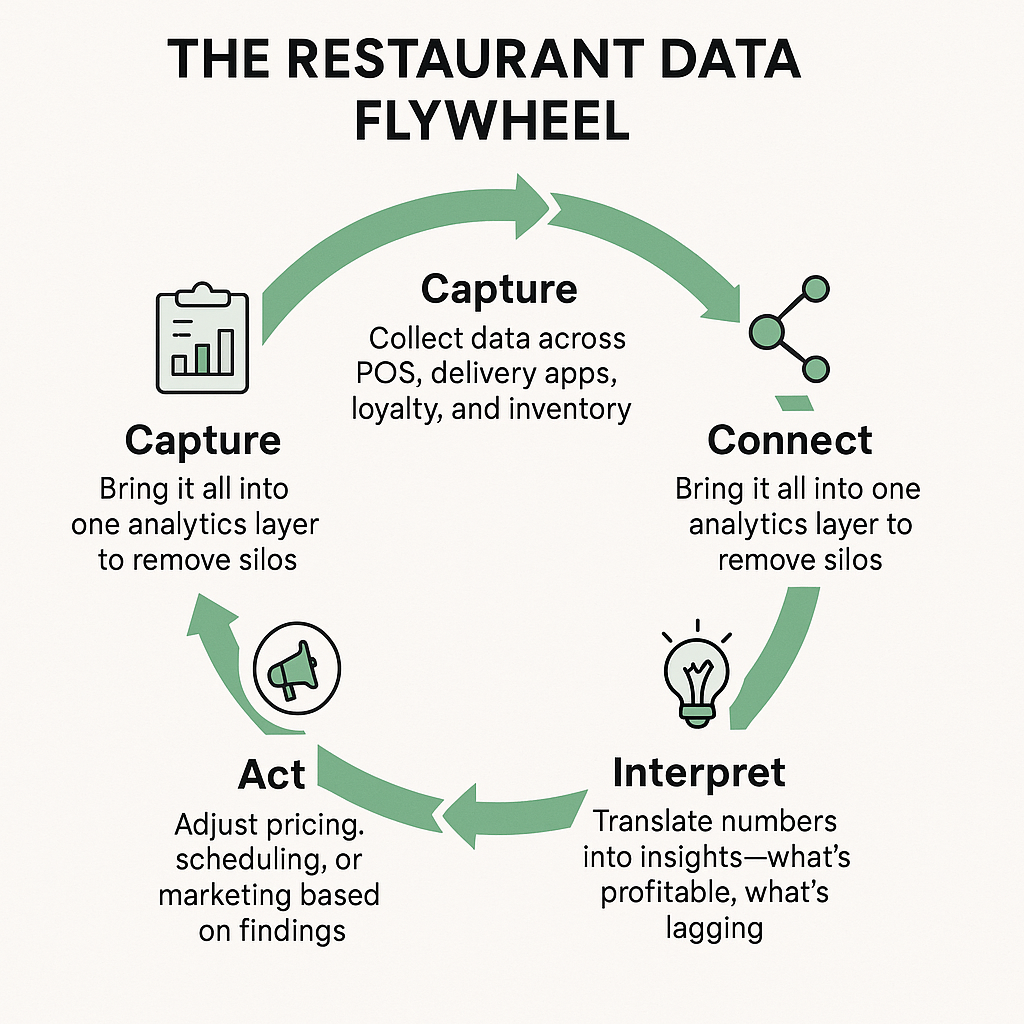
Understanding Restaurant Sales Analytics
Restaurant sales analytics is the process of collecting, organizing, and interpreting sales data. It uncovers spending patterns, tracks sales performance, and assists restaurant owners like you in making informed decisions.
Of course, to begin with restaurant sales analytics data, you need the right sources of data.
- Sources of restaurant sales data
Restaurant sales analytics pulls insights from all parts of your business operation: order, guests, inventory, and staff, surfacing key data points like item-level sales, average ticket size, peak order times, table turnover rates, promo performance, and customer behavior trends.
Here’s where this data typically lives in your restaurant operations:
- Point-of-sale (POS) systems provide detailed transaction records, item modifiers, and time-stamped order history
- Restaurant ordering platforms capture delivery and takeout patterns, location-based trends, and digital upsell performance
- Loyalty programs and CRM systems reveal customer preferences, spend history, and repeat visit frequency
- Inventory and kitchen management tools track ingredient usage, waste, and cost trend
When this data is centralized and analyzed together, it becomes a powerful decision-making tool, not just a report to check after close.
The Benefits of Leveraging Restaurant Sales Analytics
Restaurant sales analytics isn’t just a fancy dashboard. It gives you the clarity about what’s working, what’s not, and where to focus your time and resources for maximum impact. It helps you grow across your restaurant’s most critical levers by:
1. Optimizing menu pricing for maximum profitability
Not all popular dishes are profitable, even when they are the best-selling items. In fact, 70% of restaurant operators say inflation and rising food costs have been their biggest challenge since 2022.
Take a popular burger that sells out daily. But if its ingredients are premium and take time to prepare, the profit margin might be razor-thin or even negative.
Now compare that to a less popular pasta dish with lower ingredient costs and a higher markup. It may not fly off the menu, but it earns more per plate.
Here’s how the numbers can stack up:
Restaurant sales analytics shows you which dishes are not just selling, but earning. You can use this data to:
- Adjust pricing or portion sizes
- Reposition high-margin items
- Remove or rework low-profit dishes
One such example is Cali BBQ in San Diego. They used analytics to implement dynamic pricing by slightly increasing prices during peak hours and reducing them during slower times.
That one change led to an extra $1,500 per month in delivery revenue, without affecting the customer experience.
Connect your menu data with Restolabs to see profit margins and performance in real time. The platform maps each item’s ingredient costs directly from integrated POS feeds and updates profit margins in real time as prices or ingredient costs change
You can adjust pricing or highlight high-margin dishes directly from the dashboard - without relying on spreadsheets!
2. Streamlining staff scheduling
Staffing is one of the trickiest parts of running a restaurant. You don’t want empty tables waiting because you're short-staffed, or excess payroll during slow hours.
And you’re not alone—in one of the sub-readdits, restaurant owners consistently report staffing and labor costs as one of their top challenges.

Here’s where restaurant sales analytics steps in. By extracting historical data on footfall, order patterns, and peak times, you can answer questions like:
- Are we overstaffed on Monday afternoons?
- Is Saturday dinner rush understaffed every week?
- Can we adjust shift timings based on actual order volume?
With the right data, you can match staffing levels to demand, cutting excess labor costs while ensuring great service during busy hours. This reduces burnout for your team and creates smoother shifts and happier guests.
Also, when you understand peak hours, order trends, and table turnover times, you can anticipate operational pressure points. This lets your team deliver smoother, faster service, and a consistently better guest experience.
Restolabs helps you align labor costs with demand.
It correlates order timestamps and delivery windows through its analytics tool, helping managers predict staffing requirements. Use these insights to see which shifts require more coverage and which ones drain payroll, helping you plan better without disrupting service.
3. Forecasting demand and contextual menu planning
Every restaurant has sales patterns hiding in plain sight. The challenge is spotting them early enough to act. Sales forecasting for restaurants reveals interesting insights to fuel your business plan:
- Seasonal sales trends (e.g., soups and hot beverages during winter)
- Daypart preferences (e.g., more salads and lighter meals during lunch hours)
- Weather-based order shifts (e.g., fewer dine-ins and more takeout orders during monsoon)
With this foresight, you can decide menus that reflect what your customers actually want, even before they ask for it. That means fewer stockouts, less food waste, and a menu that always feels cooked to excite the customer’s taste buds.
- Seeing It in Action: Two Restaurants, Two Outcomes
To understand how data forecasting changes outcomes, let’s compare these two restaurants:
4. Running accurately targeted marketing campaigns
Too often, restaurants fall into the trap of running blanket promotions: “10% off for everyone”, hoping it’ll boost sales. But this one-size-fits-all approach can bleed margins without actually driving loyalty or higher ticket sizes.
Restaurant sales analytics flips the script. By tapping into real-time sales and customer behavior data, you can segment your audience based on order history, frequency, average spend, order timing, or even geography, and craft hyper-relevant marketing campaigns that convert better.
For example:
- Send a “We miss you” deal to diners who haven’t ordered in 30+ days
- Offer a surprise dessert to customers who consistently spend above $50
- Run exclusive weekday lunch deals for office-goers who frequently order between 12–2 PM
- Target regulars who haven’t tried a specific dish yet with a limited-time discount
And it’s not just theory. Restaurants that use targeted, data-driven promotions often report up to 20% higher ROI compared to broad, one-size-fits-all campaigns.
Inside Restolabs, your ordering and loyalty data feed directly into the analytics engine. It automatically segments users based on lifetime value, recency, and item affinity, letting you trigger campaigns or offers across email, SMS, and push in real time.
Because it’s all in one system, you can track promotion ROI down to the individual coupon or channel. Read more about how data analytics can unlock higher restaurant revenue.
3 Hidden Profit Leaks That Analytics Reveals
Even well-run restaurants lose margin quietly every day. Analytics helps you uncover leaks you can’t see on your P&L:
How To Get Started With Restaurant Sales Analytics: A Practical Checklist
There are several stages of getting started and cruising forward with restaurant analytics. It typically moves from data collection and standardization to building the right team and tech stack. Follow this checklist to take a step forward to driving higher restaurant revenue:
1. Gather all your data together
- Collect real-time data consistently from all key sources (POS, online orders, inventory management system, CRM, and delivery platforms), into a single analytics dashboard or system
2. Clean and standardize your data
- Clean and format your data to ensure accuracy; Remove duplicates, fix inconsistencies, and verify correctness
- Standardize variables and units (like, currency, timestamps, product names) to ensure uniform analysis
- Establish a data hygiene process for regular validation and maintenance of your datasets
3. Define your key metrics (KPIs)
- Identify core KPIs based on your business goals
- For example:
- Profitability: Average order value, margin per dish
- Operations: Labor cost percentage, table turnover rate
- Customer Loyalty: Repeat order rate, promotion response rate
- Set benchmark values for each KPI to track progress over time.
- Revisit and refine metrics regularly as your goals evolve.
4. Build a data-centric team culture
- Train staff on data literacy basics—how their inputs contribute to larger business insights
- Empower team leads to use data for scheduling, menu planning, and daily operations
- Reward data-driven decisions to encourage adoption across roles and locations
5. Choose the right analytics tech stack
- Evaluate analytics tools that integrate seamlessly with your POS, CRM, accounting, and delivery systems
- Prioritize ease of use, real-time reporting, and customizable dashboards
- Select tools that support multi-location or franchise operations
Restolabs And Data Stack Integration
When building your analytics stack, look for tools that integrate cleanly with your POS, CRM, and delivery systems.
With Restolabs Analytics, all of your online-ordering data is gathered into a unified dashboard so you can instantly see what’s moving and what’s not. For instance:
- Track your best- and worst-selling items
- Compare menu performance by location or time period
- Dive into the customer-level detail (e.g., top spenders)
You’ll also see exactly which promos, coupons and discounts drove the most sales (and which didn’t), enabling you to turn raw numbers into smart decisions.
Drive Revenue With Restaurant Sales Analytics
The most successful restaurant brands, locally and globally, aren’t guessing their way to growth. They are using data to plan their menus optimally, schedule staff, and to serve better customer experience consistently.
If you’re ready to do the same, Restolabs can help. With real-time reporting, menu-level profit analysis, demand forecasting, and campaign tracking, it gives you the operational visibility you need to grow with precision.
See how unified restaurant analytics can work for you. Book a demo and explore Restolabs’ analytics suite in action.

Sruthi Sekar specializes in brand strategy, growth, and user experience in the hospitality industry. As the driving force behind Restolabs, she helps restaurants harness technology to scale and thrive. With a background in design, branding, and entrepreneurship, she brings a sharp focus on crafting digital experiences that drive real business impact.
Frequently Asked Questions
Sales forecasting involves using historical data and patterns like seasonal demand, daypart trends, and past sales. The primary objective of sales forecasting is to predict future revenue and customer flow. However, it also assists in planning staffing, managing inventory, and designing menus with less guesswork.
The most commonly tracked metrics include average order value, table turnover rate, labor cost percentage, food cost percentage, customer retention rate, and item-level sales performance. There are more metrics, but these are considered foundational for restaurant sales analytics.
Restaurant success is measured by a mix of financial, operational, and customer-centric KPIs. Profit margins, sales growth, cost control, guest satisfaction scores, and repeat visit rates all provide a balanced view of performance.


.webp)

.svg)
.webp)