
.gif)
Key Takeaways
- Restaurant data analytics drives clarity: When sales, orders, and customer behavior are analyzed together, you gain a clear view of what impacts revenue, cost, and demand.
- The right metrics matter most: Focus on core KPIs like AOV, item-level margins, retention, and fulfillment timeliness to evaluate performance with context.
- Clean data enables confident decisions: Consistent naming, complete fields, and aligned timelines prevent misleading reports and unreliable insights.
- Benchmarks give analytics meaning: Comparing performance against historical trends or defined thresholds helps you separate normal variation from real issues.
- Integration unlocks real value: Connecting analytics with POS and online ordering systems ensures insights reflect how orders are actually placed and fulfilled.
- Insights must lead to action: Restaurant data analytics is effective only when it informs pricing changes, staffing adjustments, inventory planning, or promotion decisions.
- The right tools simplify execution: Restaurant data analytics solutions help translate raw data into practical insights without manual reporting or technical complexity.
Restaurants generate data every day, from sales receipts and delivery orders to feedback forms and social stats. Yet most teams barely scratch the surface of what that data can do. As operations grow, relying on gut instinct or basic reports leads to missed opportunities.
Restaurant data analytics changes that by turning scattered numbers into clear insights that help you set the right prices, schedule accurate staffing shifts, or run targeted promotions.
In this guide, we’ll break down what restaurant analytics really means, the metrics that matter most, and how platforms like Restolabs make it simple for you to make the most of data, the way it should be. Let’s get started.
What Is Restaurant Data Analytics?
Restaurant data analytics is the systematic analysis of operational, transactional, and customer data generated across a restaurant’s systems to measure performance, identify demand patterns, and inform decisions related to revenue, cost control, and customer retention.
It integrates data from sources such as POS transactions, inventory movement, online and in-store orders, reservations, delivery activity, loyalty programs, and customer feedback.
By correlating these datasets, you can quantify menu performance, forecast demand, optimize inventory and staffing, and evaluate the impact of pricing, promotions, and fulfillment channels on profitability.
Bonus read: How data analytics can help restaurants generate higher revenue
Why Restaurant Data Analytics Matters for Growth
In 2025, several large restaurant chains filed for bankruptcy, highlighting how fragile margins have become across the industry.
Restaurants that rely on data-driven decision-making are better equipped to respond to this pressure by improving visibility into performance and cost drivers. Restaurant data analytics enables you to:
- Optimize menu performance by identifying low-margin or low-conversion items
- Reduce food waste through demand forecasting based on seasonality and historical sales
- Improve marketing efficiency by measuring which campaigns drive repeat visits and long-term value
For example, Sweetgreen uses a centralized analytics approach to standardize data tagging and cleansing across digital and in-store systems.
By consolidating app usage, marketing performance, and point-of-sale data, the company can track reliable KPIs, identify customers at risk of churn, and better understand the behaviors of its most loyal segments.
Types of Restaurant Data Analytics
Restaurant data analytics can be broken down into four main types:
1. Descriptive analytics
Descriptive analytics looks at historical data to understand what happened in your restaurant. It answers questions like:
- What were the top-selling items last month?
- How did the promotional discount impact sales?
- Which days of the week have the highest foot traffic?
By analyzing past performance, you can identify trends and patterns to better align your strategy with actual data, giving you the clarity to make informed decisions.
2. Diagnostic analytics
Diagnostic analytics digs deeper to uncover why certain events occurred. It helps identify the root causes behind trends and patterns. For example:
- What caused a dip in repeat customers?
- Why were certain menu items less popular than others?
- Did staffing levels impact order wait times during peak hours?
This type of analysis helps identify the “why” behind the “what,” allowing you to take corrective actions where necessary.
3. Predictive analytics
Predictive analytics uses historical data and trends to forecast future events or behaviors. It helps anticipate what might happen under certain conditions. For example:
- Which menu items are likely to become popular in the next quarter?
- How much stock should you order based on future demand?
- What weather patterns will influence customer traffic?
With predictive analytics, you can prepare for busy times or predict customer demand, allowing for better planning and resource allocation.
4. Prescriptive analytics
Prescriptive analytics takes predictive data a step further by recommending actions. It answers questions like:
- How can we improve menu item profitability?
- Which marketing strategies will drive more repeat customers?
- What staffing adjustments should we make during peak hours?
This type of analysis provides actionable recommendations based on predictive insights, guiding you on what steps to take to achieve desired outcomes.
Key Restaurant Metrics to Track in 2026
Let’s take a look at the top restaurant performance metrics to prioritize in 2026:
1. Sales & Average Order Value (AOV)
- Measures overall revenue health and per-order monetization
- Formula: Total Revenue ÷ Number of Orders
- Benchmark: Track trend over time
2. Menu Item Profitability
- Measures contribution margin at the item level
- Formula: (Selling Price − Food Cost) ÷ Selling Price × 100
- Benchmark: 65–70% gross margin; review weekly
3. Table Turnover Rate
- Measures seating efficiency during service windows
- Formula: Tables Served ÷ Tables Available
- Benchmark: 3–4 turns per table during peak hours (casual dining)
4. Customer Retention Rate
- Measures percentage of returning customers
- Formula: (Repeat Customers ÷ Total Customers) × 100
- Benchmark: 60–70% for stable performance
5. Delivery & Takeout Timeliness
- Measures reliability of off-premise fulfillment
- Formula: (On-Time Orders ÷ Total Orders) × 100
- Benchmark: 90%+ on-time rate
6. Customer Feedback & Ratings
- Measures qualitative customer experience signals
- Metric: Average rating across platforms
- Benchmark: Maintain 4.0+ average rating
7. Marketing ROI
- Measures campaign-level efficiency
- Formula: (Revenue − Campaign Cost) ÷ Campaign Cost × 100
- Benchmark: 3–5× ROI for paid campaigns
Implementing Data Analytics in Your Restaurant
The steps below outline how restaurants can move from fragmented operational data to actionable, decision-ready insights:
1. Set clear goals for your analytics
List the decisions that affect revenue and cost on an everyday basis. This could include menu pricing changes, inventory ordering, staffing adjustments, promotion timing, and delivery partner performance. When a decision is clearly defined, the data required to support it becomes easier to identify and evaluate.
2. Identify and consolidate your data sources
Take inventory of the systems where your restaurant data is stored, such as your POS, online ordering solution, delivery platforms, reservation tools, and customer feedback channels.
Note what each system captures, how frequently the data updates, and whether the same data points are recorded consistently across channels.
Decide how much historical data to include before analyzing anything. Choose a timeline that’s mapped with your operating reality, such as the last three to six months for recent performance or a full year to account for seasonality.
A defined time range prevents skewed conclusions and ensures trends are evaluated in the right context.
3. Clean and standardize your data
Before you look for insights, make sure the data coming from different systems follows the same structure and naming conventions. Inconsistent labels, missing fields, and partial records create misleading reports and make metrics unreliable.
In practice, these issues often look like this:
Clean data leads to confidence in every number you review.
4. Define the metrics and benchmarks you’ll measure against
Once your data sources are identified and cleaned, decide which metrics you’ll use to evaluate performance. These metrics act as reference points for your analysis and prevent conclusions based on intuition or one-off results.
Select a small set of metrics tied directly to your goals, such as average order value, item-level margin, table turnover, repeat order rate, and on-time fulfillment.
For each metric, set an acceptable range or benchmark based on historical performance, seasonality, or known industry thresholds.
5. Analyze the data and act on what it shows
Review trends over time rather than isolated data points. Look for patterns that repeat across days, weeks, or service periods, such as consistent margin drops on specific items, recurring delivery delays, or demand spikes tied to time or channel.
Translate each insight into a clear action. Adjust pricing, revise reorder quantities, change prep schedules, pause underperforming promotions, or address operational bottlenecks. Analysis only creates value when it leads to measurable changes in how your restaurant runs.
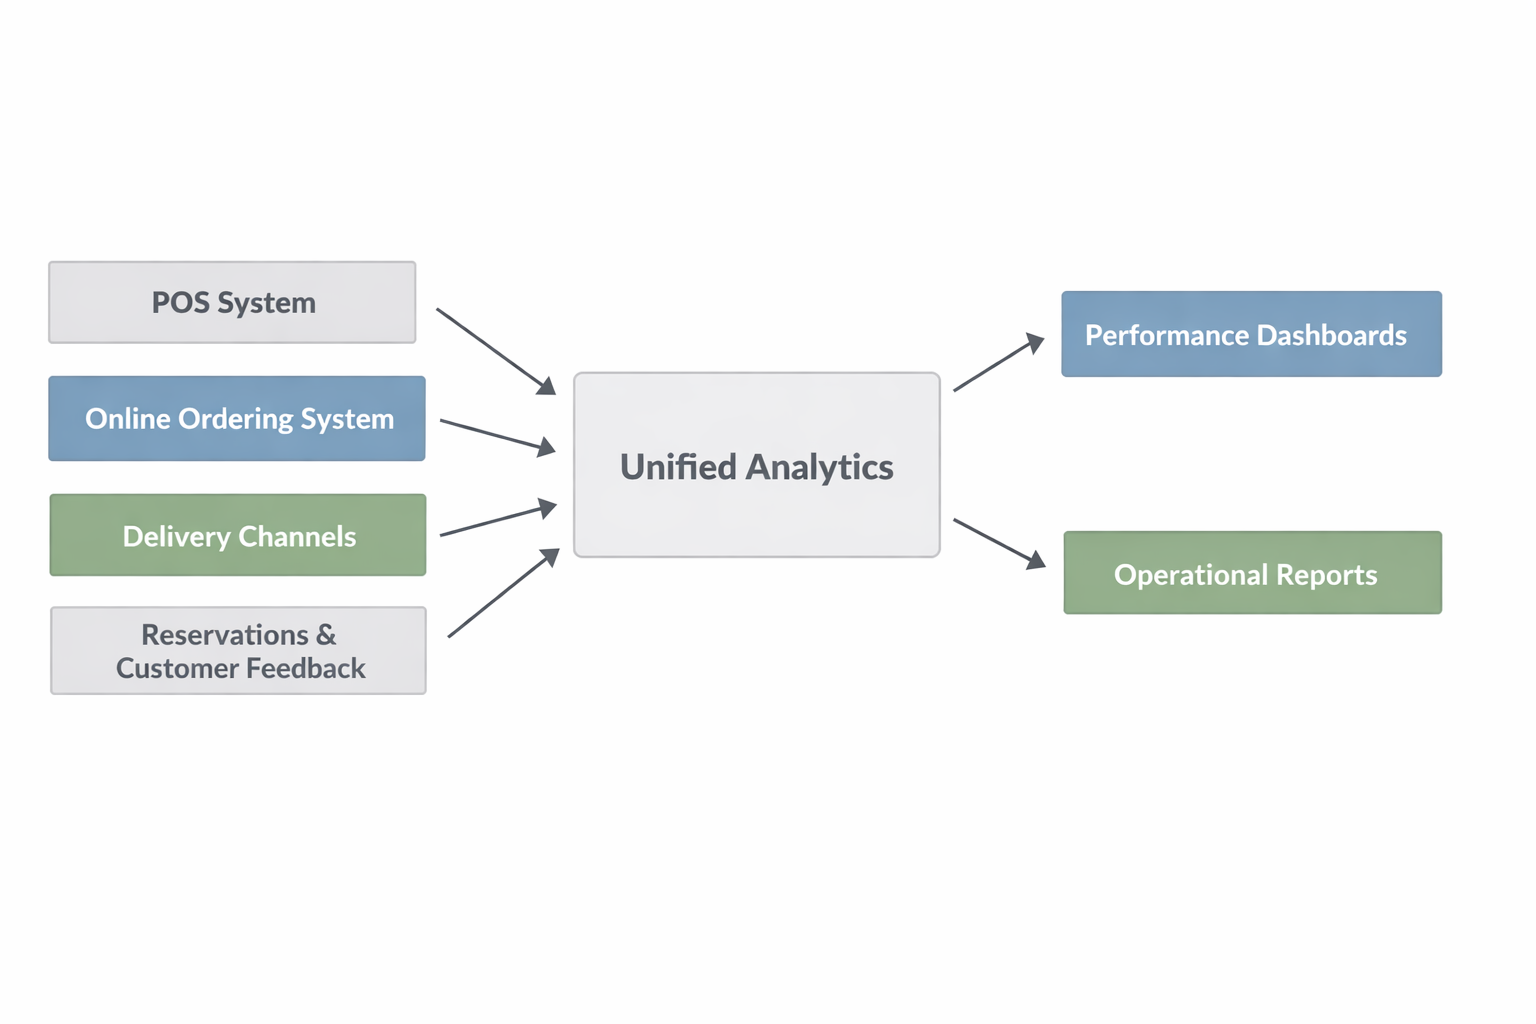
Integrating Analytics With POS and Online Ordering Systems
When you connect analytics directly to your POS and online ordering systems, you get a single, consistent view of how orders are placed, fulfilled, and completed.
Sales, item-level demand, discounts, fulfillment methods, and customer behavior are captured at the source, which removes gaps caused by manual exports and mismatched system records. With near real-time data, you can see what is happening during service rather than after it ends.
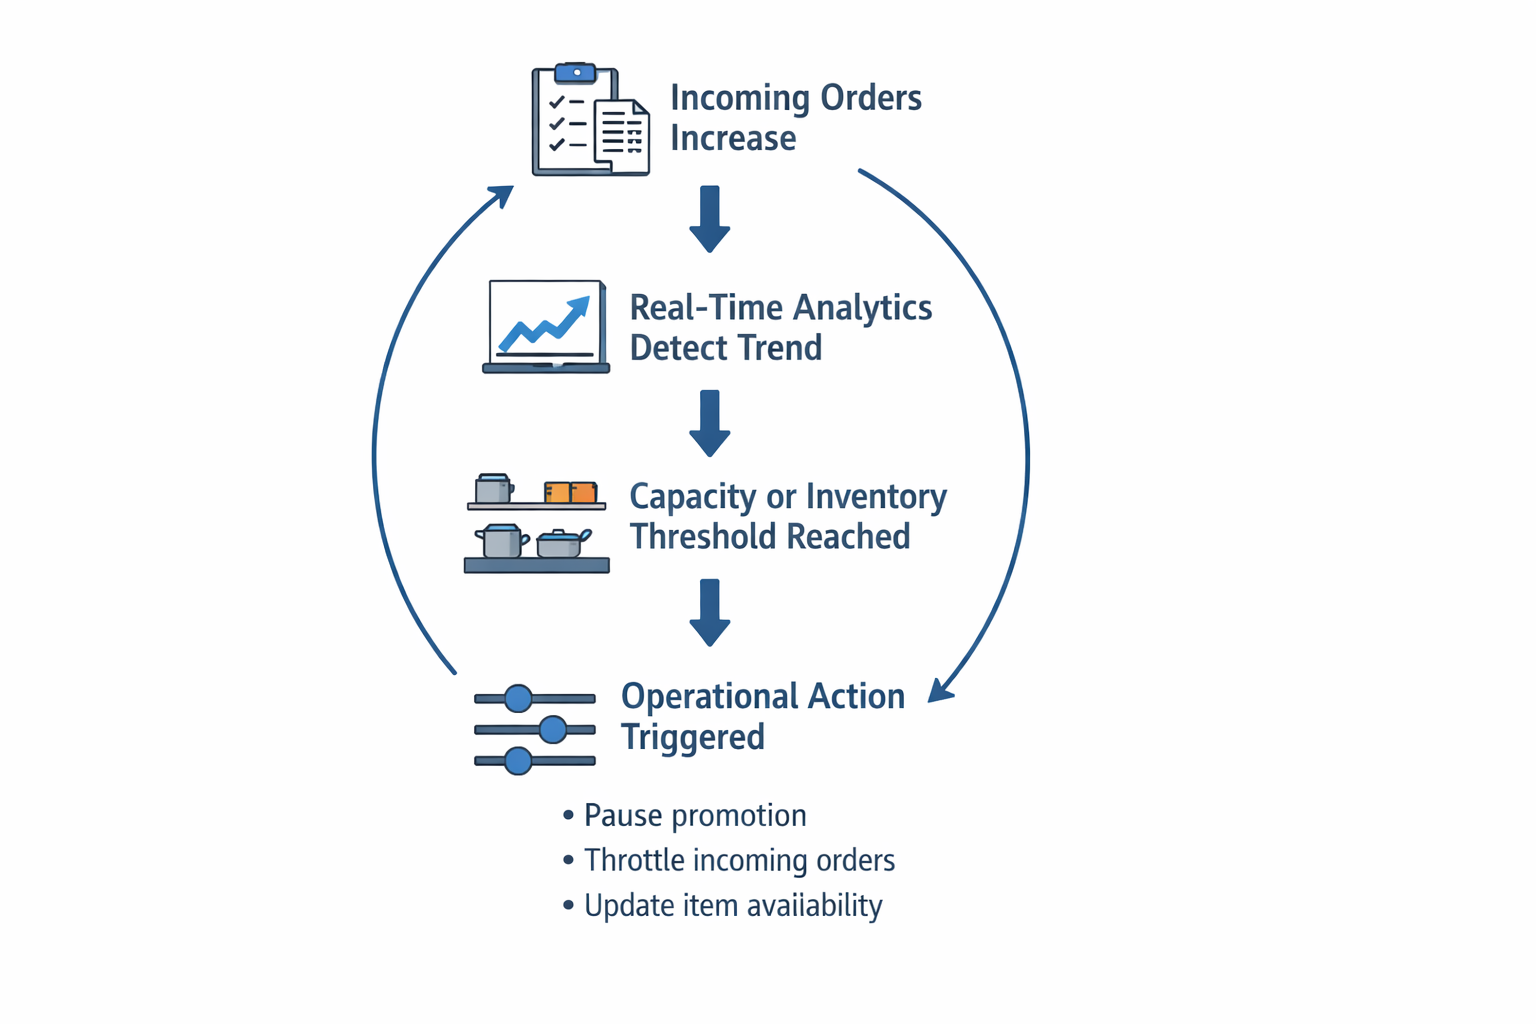
If a menu item starts trending during peak hours, you can respond immediately by adjusting prep priorities, reallocating staff attention, or pausing promotions before inventory runs low or kitchens hit capacity limits.
Direct integration also makes analysis more practical
Because orders are recorded consistently across channels, you can compare promotional performance against baseline sales, review average order value by fulfillment type, or analyze order volume by time of day using the same underlying data.
This keeps reports stable and comparable instead of fragmented across tools.
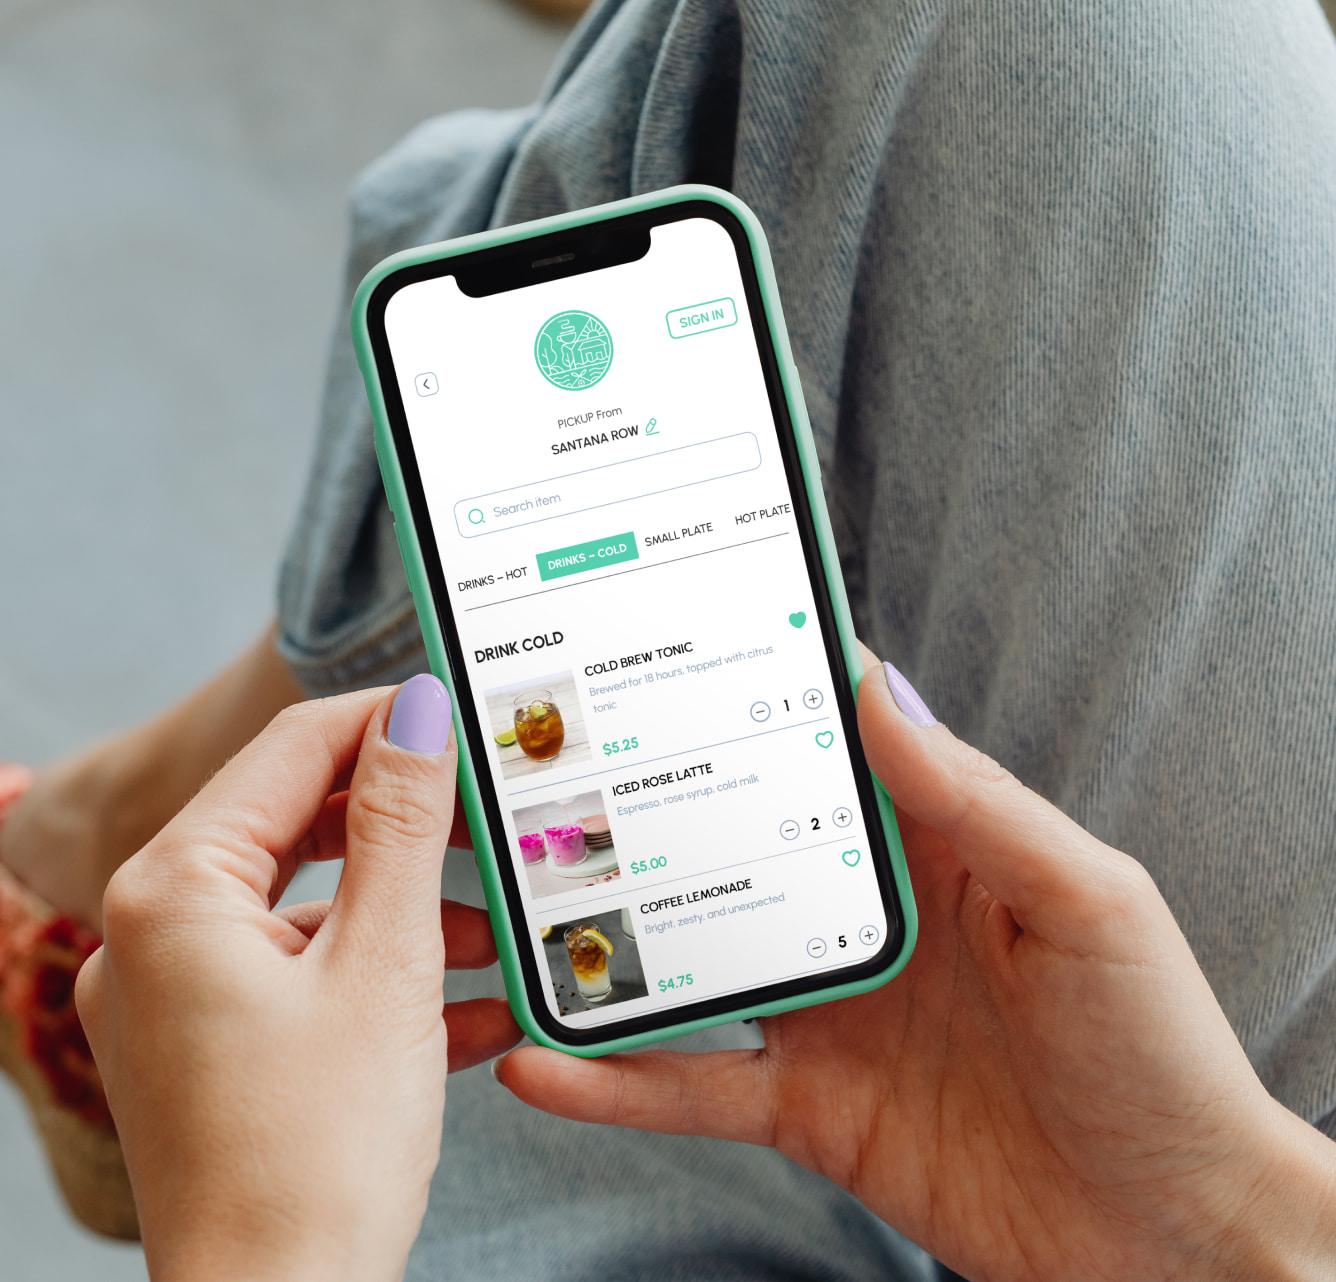
Platforms like Restolabs support this by keeping menu data, pricing, modifiers, and availability synchronized across direct ordering channels.
- Features such as Quick Menu Setup and centralized menu management reduce configuration errors and ensure analytics demonstrate what customers actually see and order.
- Analytics becomes more useful when it connects to operational controls. If incoming order volume exceeds kitchen capacity, order throttling and busy hours let you slow or pause orders before service quality drops.
- Inventory-aware menus and stock counters remove unavailable items in real time, keeping demand signals aligned with sellable inventory.
- For multi-location setups, centralized integration keeps metrics consistent across stores and channels.
With menus, pricing rules, and order logic managed from one place, you can compare performance over time without reconciling conflicting reports from multiple systems.
Turn Data Into Profit with Restolabs
Restaurant success depends on making informed decisions backed by real data. Restolabs provides you with real-time reports, operational insights, and full ownership of your ordering and customer data without the complexity or hidden fees of enterprise analytics systems.
Here’s how you can use Restolabs data effectively:
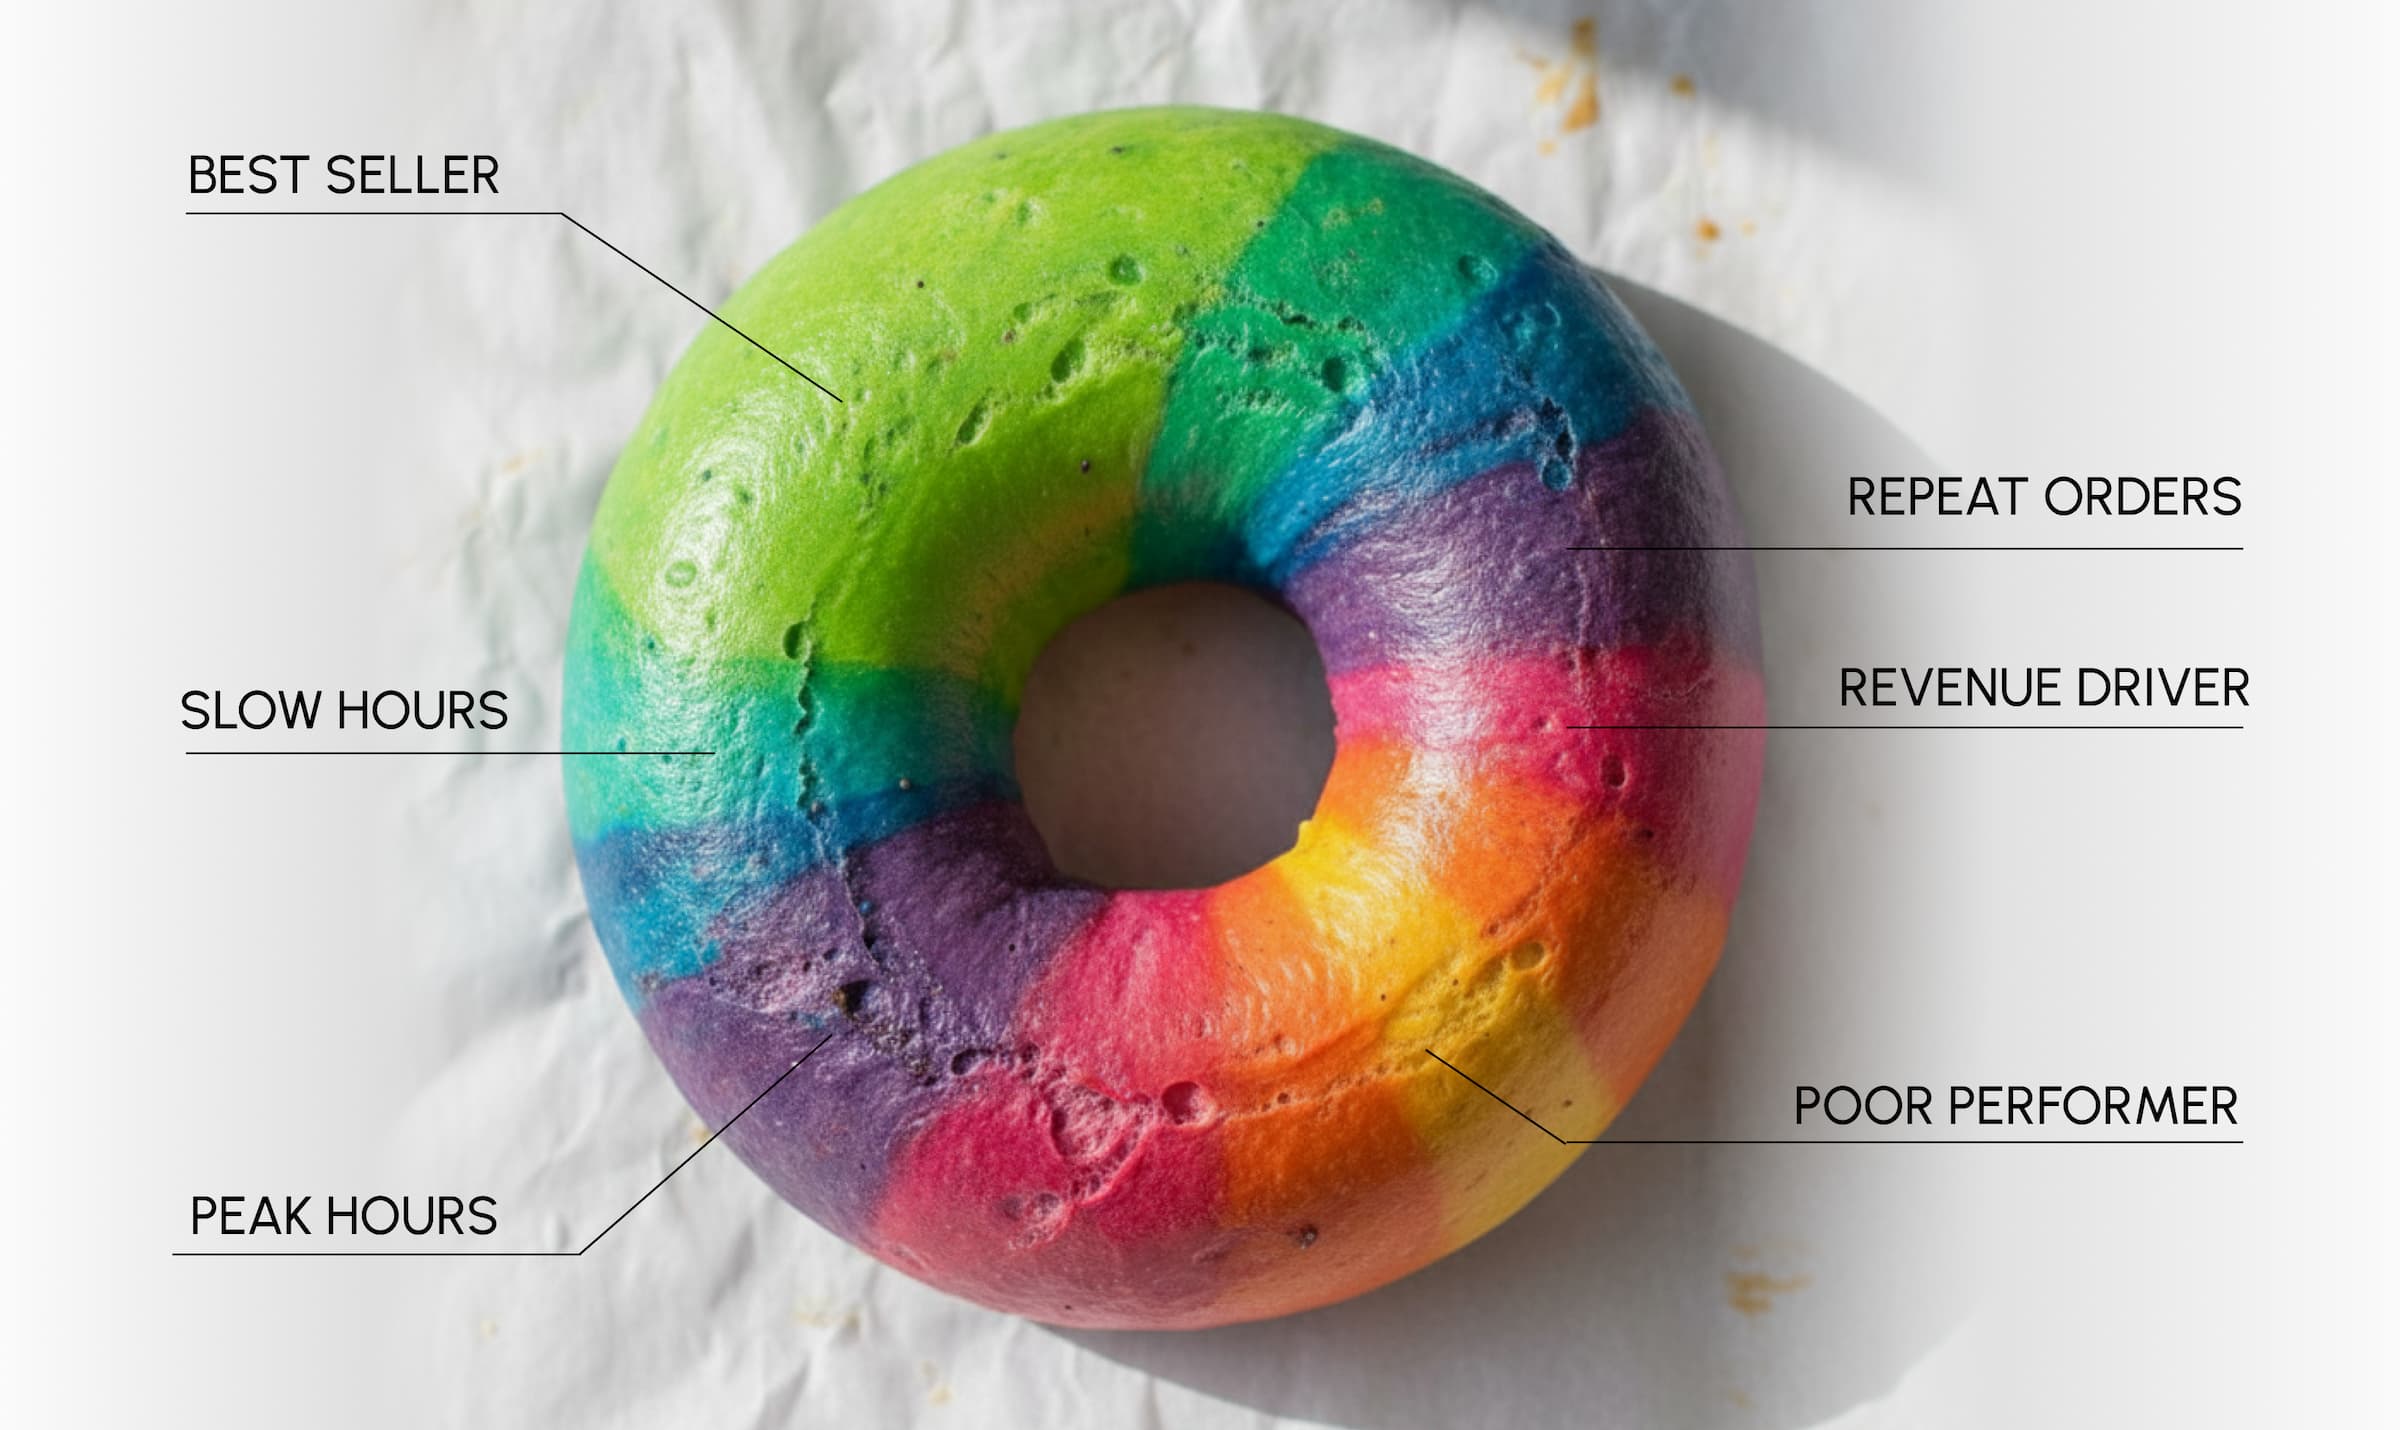
- Identify top-selling and low-performing dishes: Analyze item-level sales performance to refine menus, adjust pricing, and focus on what customers actually order.
- Track daily sales, average order value (AOV), and peak hours: Understand demand patterns by time of day and order mode to better optimize staffing, promotions, and kitchen capacity.
- Monitor order flow and fulfillment performance: Review order volumes, prep times, and fulfillment trends across pickup, delivery, and dine-in to improve service efficiency.
- Analyze repeat orders and customer purchasing behavior: Identify loyal customers and repeat-order trends to inform loyalty programs, targeted promotions, and retention strategies.
- Plan inventory and prep more accurately: Use historical order data and real-time item availability to reduce stock-outs, minimize waste, and align inventory with demand.
- Evaluate promotion and loyalty performance: Track coupon usage, loyalty redemptions, and order impact to understand which offers drive conversions and repeat business.
Ready to put your data to work? Book a demo with Restolabs and see how integrated analytics can support smarter, more profitable decisions.

Sakthi Vignesh is a product and technology leader specializing in scalable solutions for the hospitality industry. As the force behind Restolabs, he focuses on building robust, user-centric platforms that help restaurants streamline operations and grow efficiently. With deep expertise in technology, product strategy, and system architecture, he drives innovation at the intersection of business and tech.
Frequently Asked Questions
No, modern restaurant data analytics solutions are designed for operators, managers, and owners. Platforms used in the data analytics in the restaurant industry focus on structured dashboards, filters, and predefined reports rather than raw data manipulation. With tools like Restolabs, users can analyze orders, customers, and menu performance without writing queries or managing databases. The system handles data collection and normalization behind the scenes, allowing teams to focus on interpretation and action.
Restaurant data analytics is valuable for restaurants of all sizes, not just large chains. While enterprise brands may invest in custom analytics stacks, most operators benefit first from consolidating POS and online ordering data into a single system. Tools like Restolabs are built to scale, supporting independent locations as well as multi-location brands with centralized reporting. Smaller restaurants gain clarity on sales trends, peak hours, and customer behavior without the overhead of enterprise tools.
Basic POS reports focus on transaction summaries, such as total sales or daily revenue, but they rarely provide operational context. Restaurant data analytics services go further by connecting sales data with order types, time-based trends, customer behavior, and menu performance. This allows restaurants to analyze how different fulfillment methods, promotions, or locations affect outcomes
The best restaurant data analytics software combines data accuracy, operational relevance, and ease of use. It should capture data at the source, standardize it across channels, and present it through clear, filterable reports. Strong restaurant data analytics solutions also align insights with real operational decisions, such as staffing, menu optimization, and order capacity management. Transparency and data ownership are equally important, ensuring restaurants can trust and export their reports as needed.
Restaurants typically begin seeing value from restaurant data analytics within weeks, not months. Once data sources are connected and standardized, trends in sales, order volume, and customer behavior become immediately visible. Restaurant data analytics solutions are most effective when teams review insights regularly and apply them to daily decisions. Early wins often include better staffing alignment, clearer menu performance insights, and improved promotion timing.


.jpeg)


.webp)

.svg)
.webp)