
RESTOLABS
Online Ordering Behaviour Report
Proprietary data from the Restolabs platform
Executive Summary
This report analyses 4M+ restaurant orders processed through the Restolabs direct online ordering platform Mar 2025 - Mar 2026, spanning 2126 locations, 479 brands, and 10+ countries. It provides an authoritative view of online ordering behaviour across cuisines, geographies, time patterns, customer retention, delivery preferences, and brand performance.
Key Findings
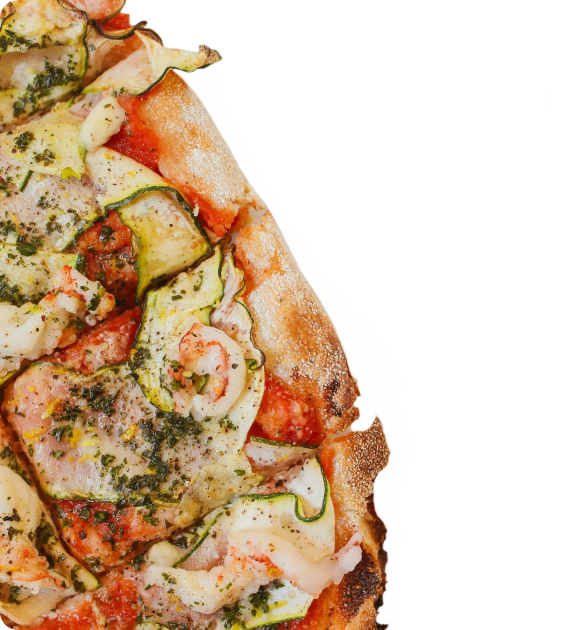
Pizza dominates with 1.35M orders — nearly 30% of all platform volume
60.1% of orders are fulfilled via pickup with delivery at 39.9%
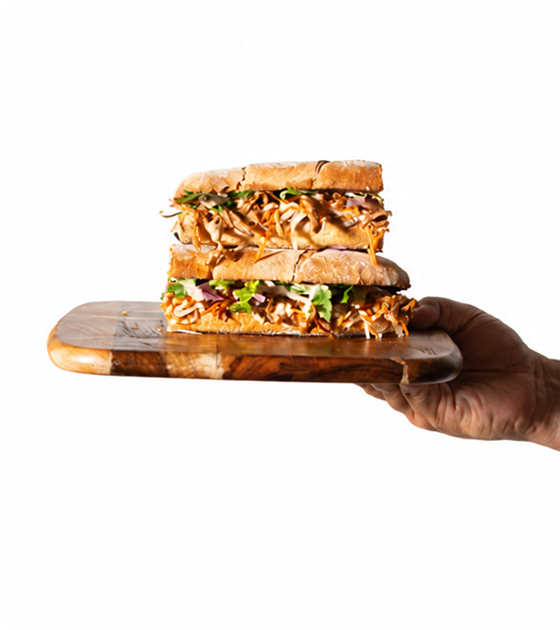
Sandwiches & Deli commands The highest average order value at $57.7
Friday leads platform-wide ordering volume, followed by Thursday and Saturday, with Monday recording the lowest order count
The highest average order value at $57.7

The United States accounts for the largest share of both orders and gross order value

Repeat customers order every 8.9 days on average, with a 38.2% repeat rate
Stop Chasing New Customers. Start Growing Revenue From the Ones You Already Have.
Get early access to marketing that plans, builds, and executes for you

.webp)

.svg)
.webp)